Your First VB Signal: Quick Start Guide
This guide takes you from the Today page to an executed trade: read the market and pick a direction, find a graded setup on the Scanner, confirm the breach on the Charts, then size and place the order in your broker. It is the same funnel you run every day.
Watch: Part 1 of the Volatility Box onboarding series.
Before you start
- A funded brokerage account that can place equity orders with a stop and a target.
- A risk-per-trade amount you are comfortable with, stated in dollars or as a percent of the account.
- Optional: the Volatility Box studies loaded in thinkorswim, so the clouds and levels plot on your broker chart. See Install the ThinkOrSwim studies.
Step 1: Read the market on the Today page
Open the Today page. It answers whether today is worth trading and which way to lean before any single setup. Read it top to bottom:
- Market snapshot: the whole market in one sentence, such as “SPY is in accumulation, day 5, stalled and neutral.”
- Breadth, range, leading sector: whether the tape is broad or thin, wide or tight, risk-on or defensive.
- Four index markets: SPY, QQQ, DIA, IWM, each tagged by stage. When they line up, lean that direction; when they split, trade smaller and more selectively.
- Where to focus: the buckets that route longs to leading sectors and shorts to weakening ones.
Accumulation or acceleration leans long; distribution or deceleration leans short. This read sets your bias for the day.
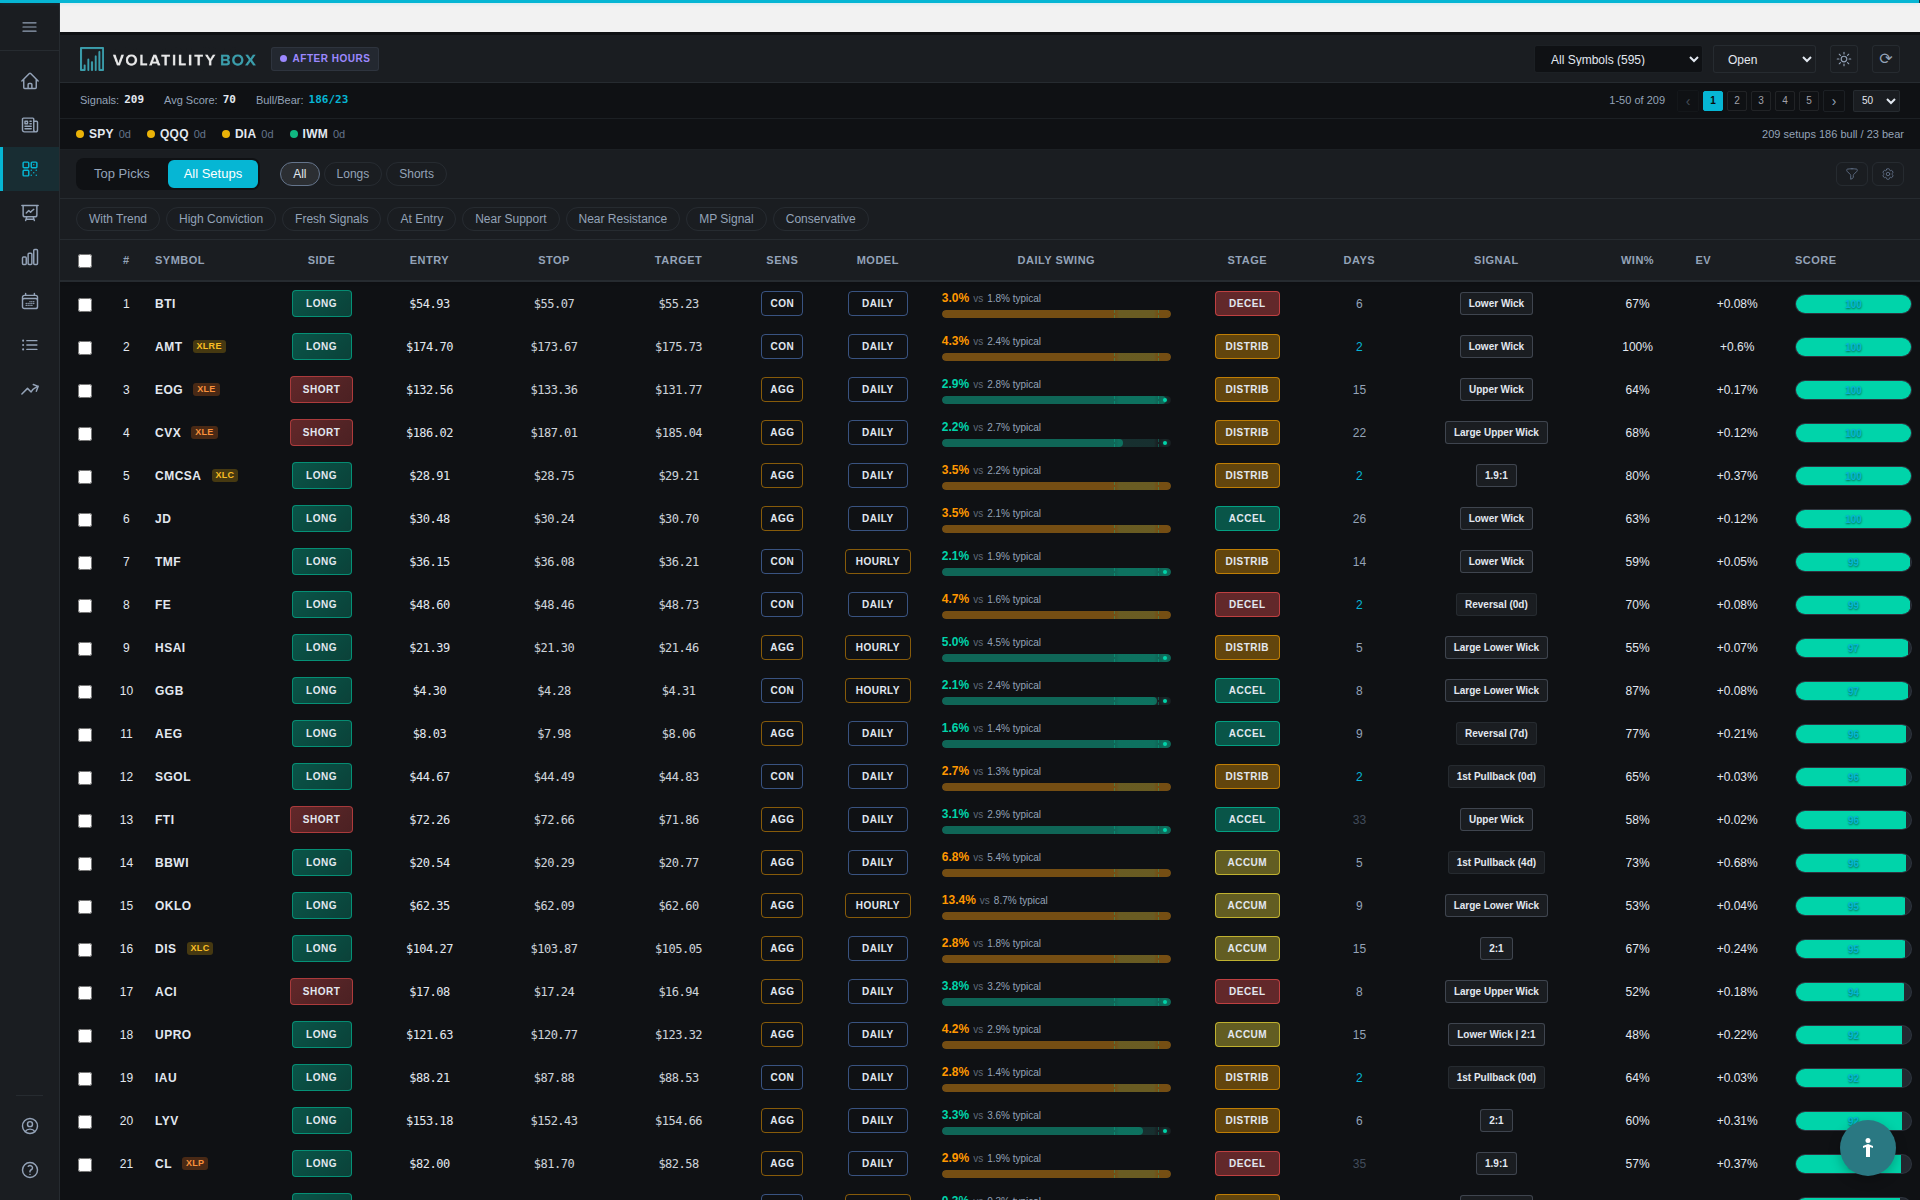
Step 2: Open the Scanner
From the Today page, or by clicking a name in the top-setups shortlist, open the Scanner. It lists the names where the models say you have an edge right now, ranked by a letter grade from A+ down. Each row carries the grade, the symbol and direction, the model that fired, the Market Pulse stage, and the historical edge. The clicked row fills the right panel with the chart, the entry, stop, and targets, and the backtest stats for that name.
Step 3: Filter to the strongest setups
Work from the top grades down. To narrow further, set the filters in your favor:
- Direction: the side the Today page pointed to. Use the long-only or short-only toggle to remove the other side.
- Trend: with-trend rather than counter-trend, so you trade with the regime.
- Regime stage: match the Today read. Acceleration or accumulation for longs, distribution or deceleration for shorts.
- Entry proximity: set entry-only to show setups still near the entry price, not ones already running to target.
That narrows the list to a handful of high-grade setups.
Step 4: Read the top setup
Click the top-graded row and read the right panel. A typical setup:
- Symbol: MSFT long
- Entry (breach): 378.50
- Stop: 376.20
- First target: 380.80
- Model: Hourly Aggressive
- Win rate: 58% over the backtest
- Market Pulse: FP (first pullback), with trend, acceleration stage
MSFT pulled back into the orange lower cloud and tagged the breach at 378.50, firing a counter-trend long. The stop at 376.20 sits below the cloud, 2.30 of risk; the first target at 380.80 is 2.30 of reward, a 1:1. A first pullback in a with-trend acceleration stage is a clean read: a pullback bought in an established uptrend. Hourly Aggressive means an intraday trade, typically a one to four hour hold, usually closed by the end of the session.
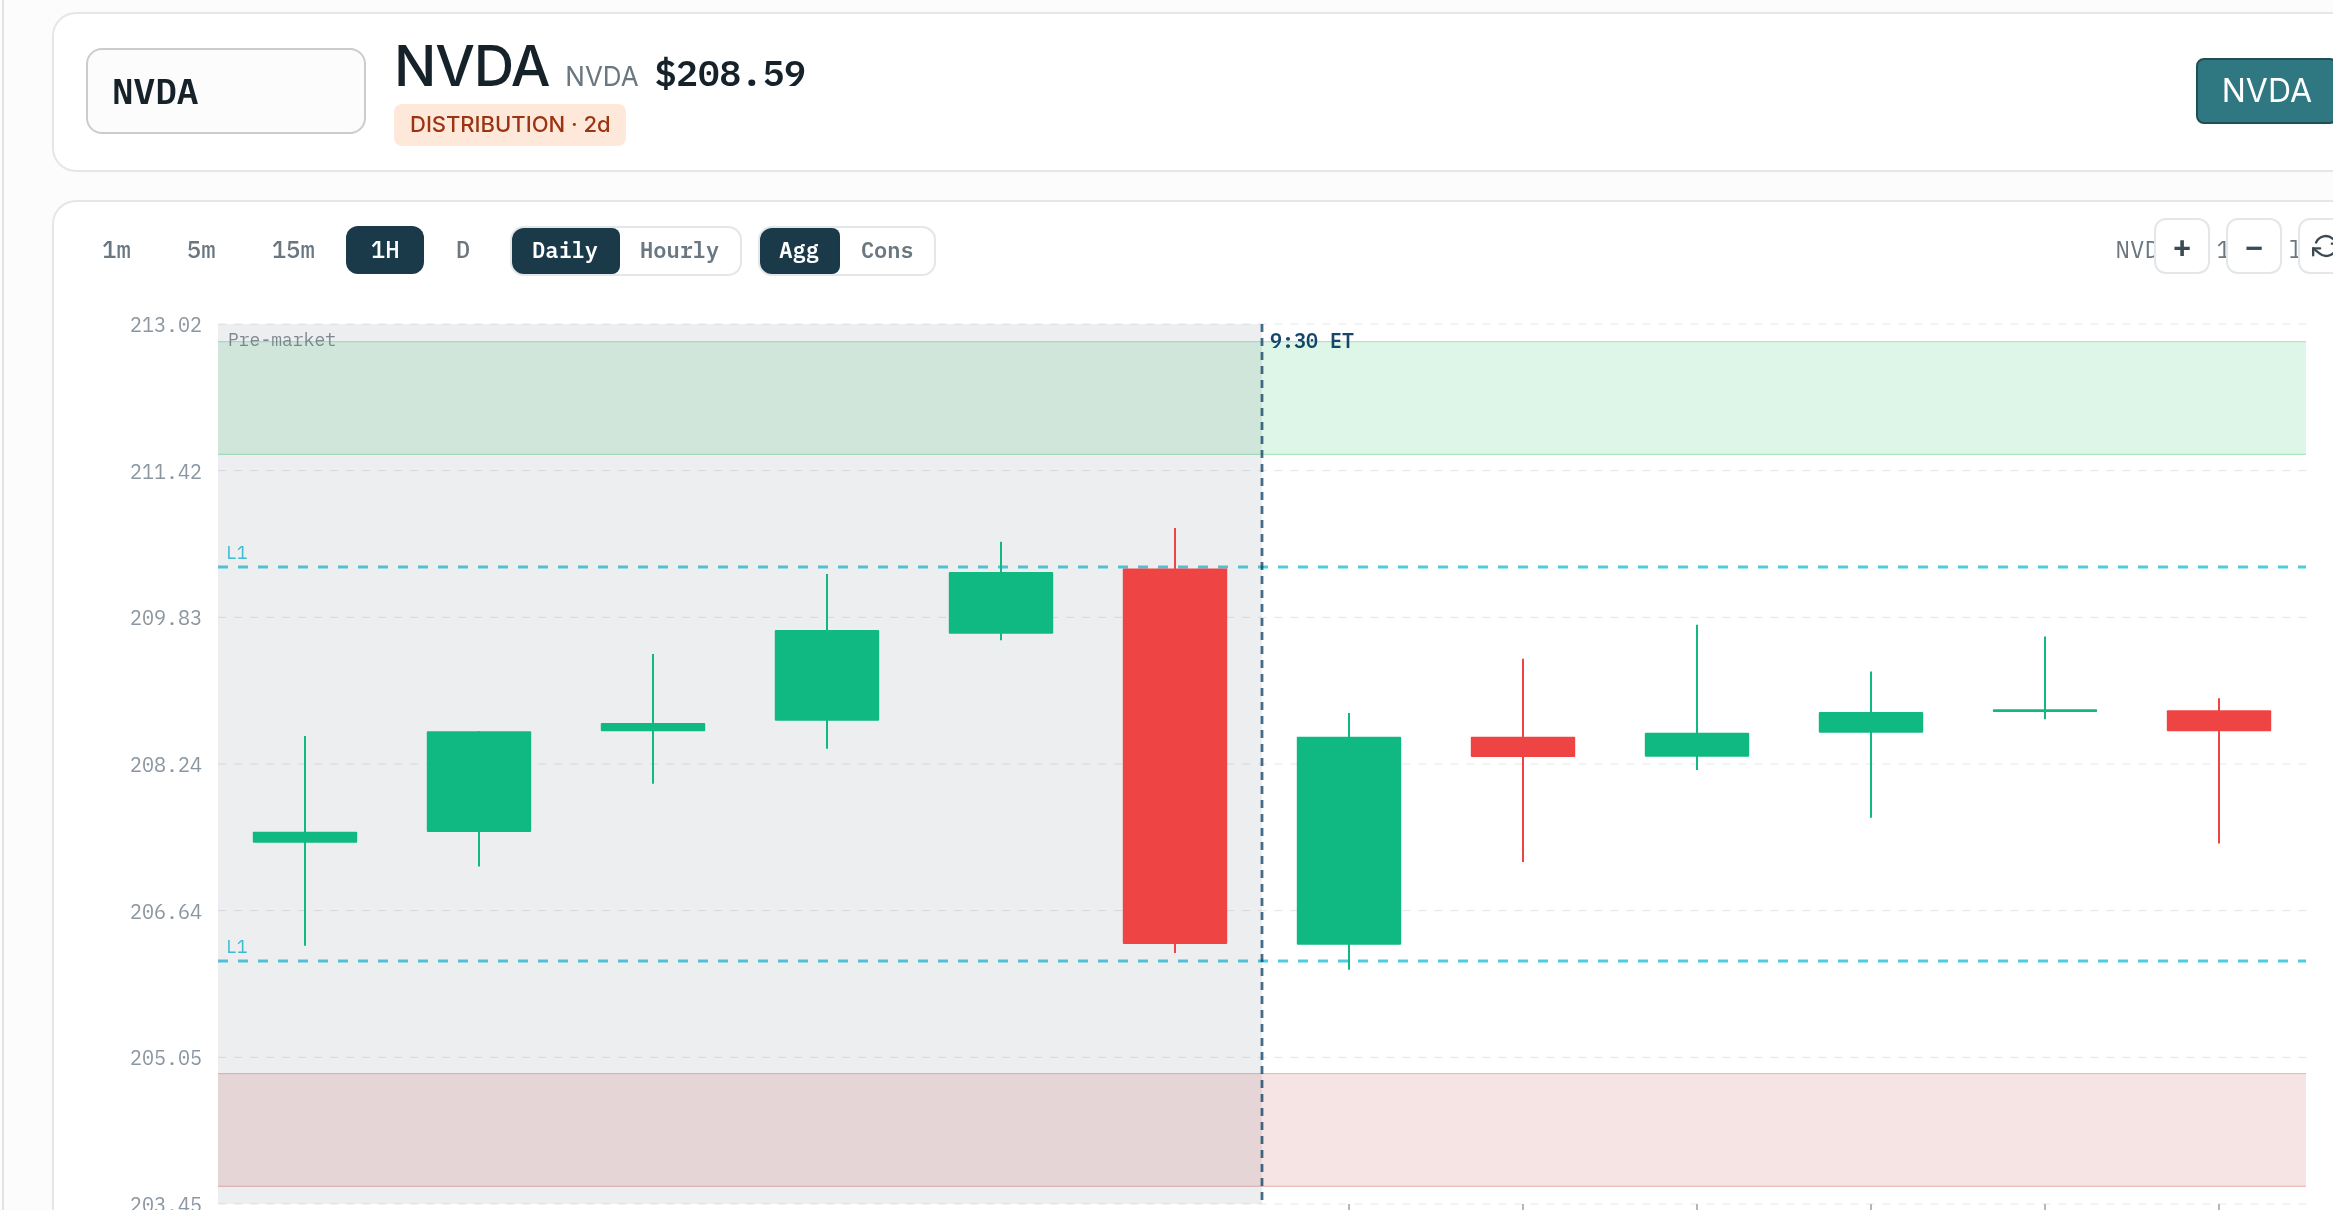
Step 5: Confirm on the chart
The right panel loads the chart with the models plotted. Toggle the timeframes (1 minute, 5, 15, 1 hour, daily) and check four things before acting:
- The clouds are not compressed or inverted. Pinched or crossed clouds mean volatility is too high; sit out, regardless of the grade.
- Price is at or near the breach level, so the entry is still live.
- Clear distance to the stop, with visual separation between price and the stop outside the cloud.
- Trend structure supports the direction. On the daily, higher highs and higher lows back a long.
Step 6: Size the position
The stop is volatility-sized: it sits outside the cloud where the model says the setup is invalidated, not at an arbitrary fixed distance. Size the position to that distance.
On a 10,000 account risking 1% per trade, the risk is 100. The entry-to-stop distance is 2.30 per share. Position size is risk divided by stop distance: 100 / 2.30 = 43 shares. At 378.50 that is 16,275, which exceeds a 10,000 cash account, so a cash account would take a smaller position. At 26 shares the cost is 9,841 and the risk is 26 times 2.30 = 59.80, about 0.6% of the account, under the 1% cap.
Step 7: Place the order
Enter the order in your broker and check it before submitting:
- Order type: limit at 378.50, or market if price is still near the breach.
- Quantity: 26 shares, from the sizing above.
- Stop: place it at 376.20 immediately. Never trade without a stop.
- Target: limit sell at 380.80.
If the studies are loaded in thinkorswim, the clouds, breach, stop, and target plot on the broker chart, which makes timing the entry easier.
Verify it worked
Back in the platform, the setup status updates as price moves: Open while price sits between stop and target, Target when it reaches 380.80, Stopped if it drops to 376.20, and EOD if the session closes before either. Set an Alert so the platform notifies you on the move instead of watching the screen.
Troubleshooting
- Price has moved past the breach. Take it only if the status is still Open, there is at least 1:1 reward left from the current price, and the wider stop is acceptable. Otherwise wait for a pullback toward the breach or skip it.
- The clouds look pinched or crossed. Volatility is too high. This is a sit-out, not a setup, no matter how the row graded.
- Unsure how long to hold. Hourly models are intraday, usually closed by the session end. Daily models are swings, held one to five days. Match your style to the model rather than swing-trading an Hourly breach.
Related
Was this article helpful?
Still need help?
Can't find what you're looking for? Our support team is here to help.
Contact Support