Strategy comparison
No single model and sensitivity works best on every symbol. Comparing the same name run two ways is how you find where its edge actually lives, which model owns it, and which sensitivity to trade.

Watch: Part 7 of the Volatility Box onboarding series.
The difference is the clue
A single backtest is a score. Two backtests of the same name with one input changed is a clue. The comparison is where the edge shows itself. Flip a daily test from aggressive to conservative and a bleeding equity curve can turn into a climbing one, which tells you the edge lives nearer the conservative models, not at the first aggressive tag. Run a name on the daily and again on the hourly and one will usually own it. You are not hunting the configuration with the most signals, you are hunting the one with the best expectancy and profit factor on that specific stock.
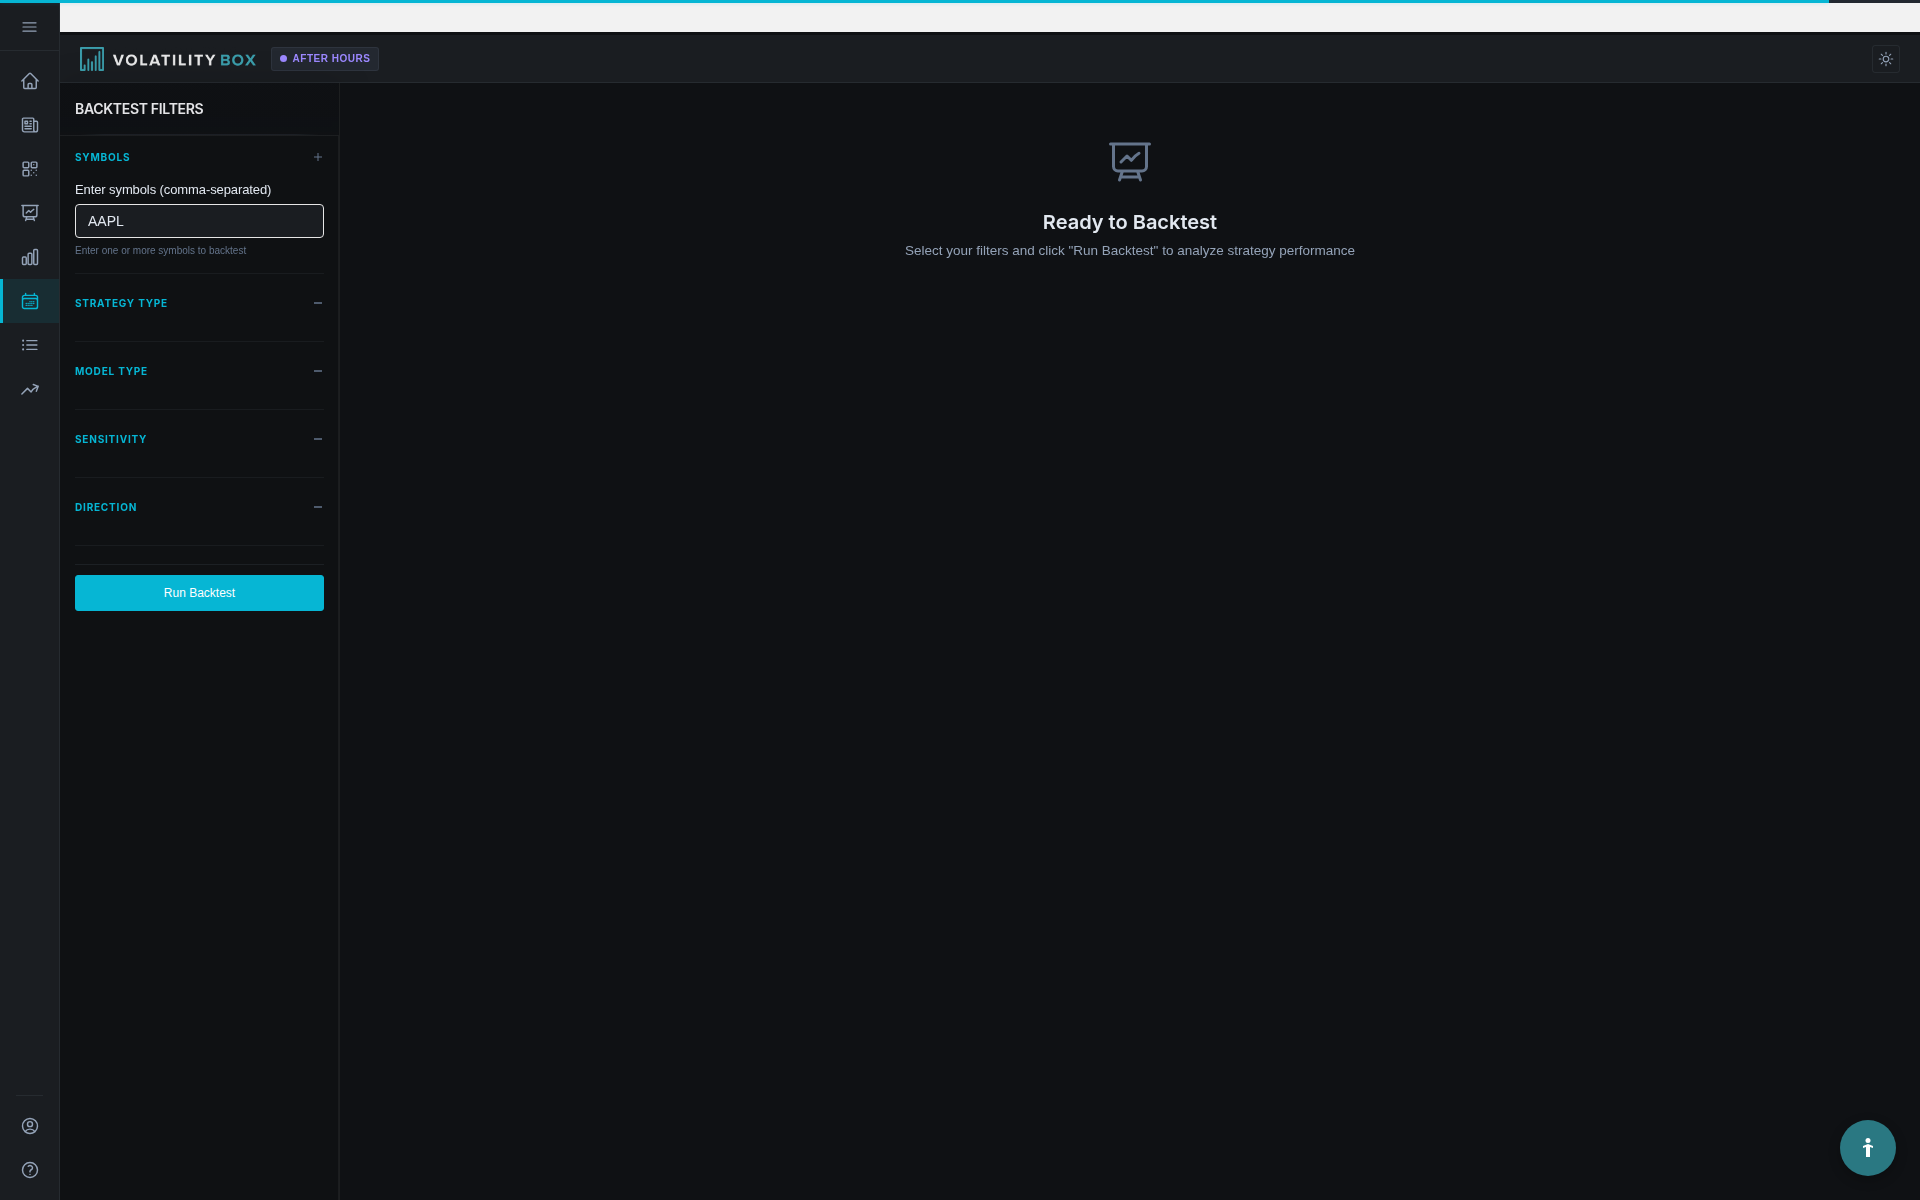
What you can compare
The control panel sets the inputs that matter: the symbol, the model (daily or hourly), the sensitivity (aggressive or conservative), the direction (both, long only, or short only), and the date range. Each combination has its own character. Conservative is more selective and fires fewer signals; aggressive runs tighter and fires more often. The point of the workflow is to let the backtester tell you which fits a given name rather than guessing.
Compare sensitivity on one symbol
Start with a name you trade often. Hold the model fixed and run it once aggressive and once conservative over the same period, so the only thing changing is sensitivity. Record what the backtester reports for each: total trades, win rate, expectancy, and profit factor. Lay them side by side.
A pattern usually emerges. The aggressive run produces more trades with modest per-trade expectancy; the conservative run produces fewer trades with stronger expectancy. The right answer is whichever shows the best expectancy on a sample large enough to trust, not the one with the most signals. UnitedHealth is a clear example from our historical backtests: its daily aggressive profit factor sits near 0.66, while the conservative run on the same name reads about 2.56. Same stock, opposite verdict, decided by one input.
Compare model on one symbol
Sensitivity is half the picture. The model type, daily against hourly, has just as large an effect. Once you have the better sensitivity, run that across both models to see which owns the name. Many large, liquid names favor the daily calculation, where the edge is a slow multi-day move; faster names need the hourly to capture their intraday behavior. Disney reads as a daily name in our historical backtests, strong on the daily and only mediocre on the hourly. Other names are dead on the daily and alive on the hourly. Let the comparison decide and keep the model that performs best on that stock.
Rank the configurations
When you compare runs, rank them with a simple hierarchy:
- Expectancy first. The configuration with the highest result per trade leads. You trade to grow the account, not to maximize signal count.
- Sample size as the tiebreaker. When two configurations show similar expectancy, take the one with more trades over the period for the greater confidence.
- Win rate as context. Use it to gauge how a losing streak will feel, not as the thing you optimize. A high win rate with weak expectancy loses to a lower win rate with strong expectancy.
A configuration with negative expectancy is out regardless of how it looks on any other measure.
From comparison to a focused list
Repeat the process across the names you trade and you end up with a validated model and sensitivity per symbol instead of forcing one configuration onto names it does not suit. Rather than trading every signal in the scanner, trade the top combinations by expectancy and ignore the rest. Fewer, better trades usually beats a scattered stream of signals.
Edges shift as regimes change, so rerun the comparison periodically on your core names. You can also run separate date ranges that line up with calmer and more volatile stretches; that often shows a configuration that looks strong on average is carried by one favorable period, which tells you when to reduce size rather than be surprised by a drawdown.
Mistakes to avoid
- Curve-fitting to a narrow window. Testing only the last few months and keeping whatever worked there. Those choices often fail when conditions shift.
- Ignoring sample size. A strong-looking result on a handful of trades is not yet trustworthy.
- Optimizing for win rate. Follow expectancy; win rate is context.
- Never reassessing. Running the comparison once and trading the same combinations through a regime change.
Related
Was this article helpful?
Still need help?
Can't find what you're looking for? Our support team is here to help.
Contact Support