Counter-Trend Reversal Setups
Counter-trend reversal setups fade the prevailing trend, fading a stretched move and betting it reverts. They are the lower-probability cousin of the with-trend breach, and they demand superior risk management and patience. This guide aligns counter-trend trading to the Volatility Box framework: breach into the far cloud, confirm with the Edge Signal, and protect it with volatility-sized stops so normal noise does not chop you out.
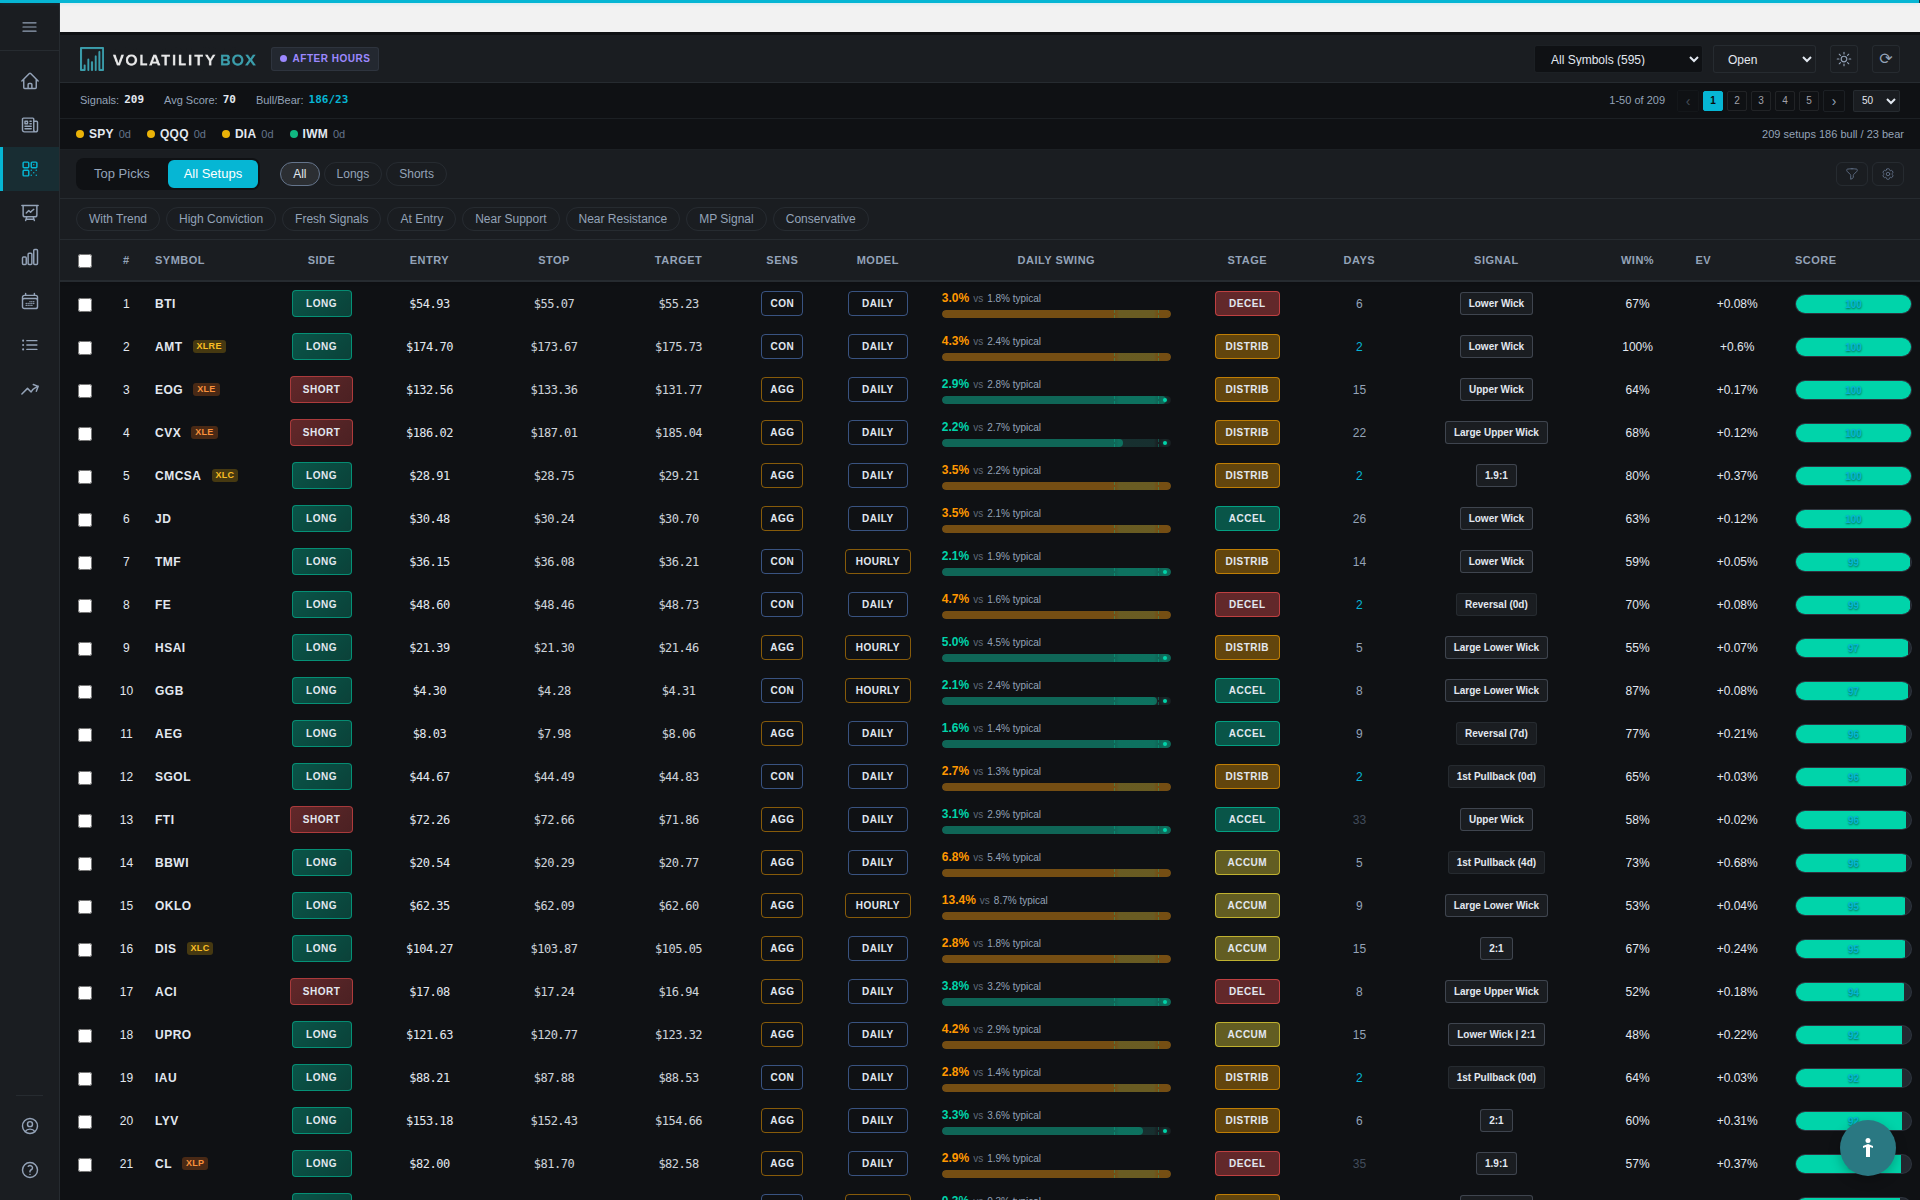
Watch: Part 5 of the Volatility Box onboarding series.
Why Counter-Trend Trading Is Harder
Trading against the prevailing trend means betting on reversals, which puts the statistical odds against you from the start. A counter-trend breach, a long-side breach (price into the lower orange cloud) while the trend is down, or a short-side breach (price into the upper green cloud) while the trend is up, is lower probability than a with-trend breach, because markets continue established trends far more often than they reverse. They do work, and you will find days where they pay, but they are the advanced path.
When counter-trend trades work, they often deliver 2:1 or even 3:1 risk-reward, because you enter at volatility extremes where reversal potential is highest. That is the payoff for the lower hit rate. This is an advanced strategy; do not lean on it until you are consistently profitable trading with the trend.
The Counter-Trend Clue: Distance From the Market Pulse Line
If you are going to fade, there is one clue that matters most, and it is a little counterintuitive: the farther price is from the Market Pulse line, the higher the likelihood of a sharp reversal worth playing. You want price as far extended as possible, already stretched enough that the market is looking for an excuse to revert to the mean. A shallow pullback against the trend is the weakest version of this trade; a deep, far-extended breach into the cloud is where the fade has its edge. Use Market Pulse to read the trend stage too, Accumulation and Acceleration lean long, Distribution and Deceleration lean short, so you know exactly which side you are fighting.
Finding Counter-Trend Setups in the Scanner
Counter-trend trading needs more selective filtering than trend following, because the base probability is lower and the margin for error is smaller. Tighten the Scanner so it surfaces only the highest-quality, far-extended reversal candidates.
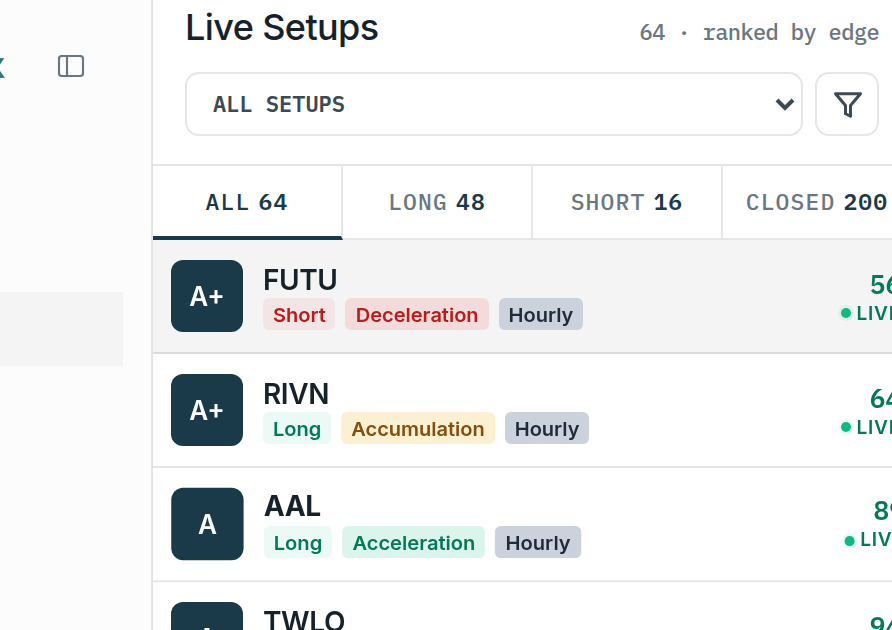
Essential Counter-Trend Filters
Set Market Pulse Alignment to AGAINST, since you want breaches that oppose the trend: long-side breaches in a down-leaning tape, short-side breaches in an up-leaning one. Favor the highest conviction and the strongest grades, A or A+ only. Do not fade on weak-grade setups; the odds are not in your favor.
Set Model to Daily Conservative for counter-trend work. Counter-trend trades need volatility-sized stops wide enough to handle the chop, and the conservative daily model places the wider, harder-to-reach cloud that gives the trade room. When a conservative daily model gets breached at the outer edge, that is one of the weightier setups the platform produces, because one level for the whole day is much harder to reach than an hourly level.
Filter for a positive Win Rate so you only see reversals with favorable history, and set Expectancy to +$0.30 or higher. Counter-trend hit rates are lower than with-trend, so the edge has to come from expectancy: you might win 60% with the trend but well under that against it, and still be profitable if the winners run far enough. Keep Status set to Open, Time to the last 2-4 hours (daily-model signals stay valid longer), and Volume to 1M+ for clean execution.
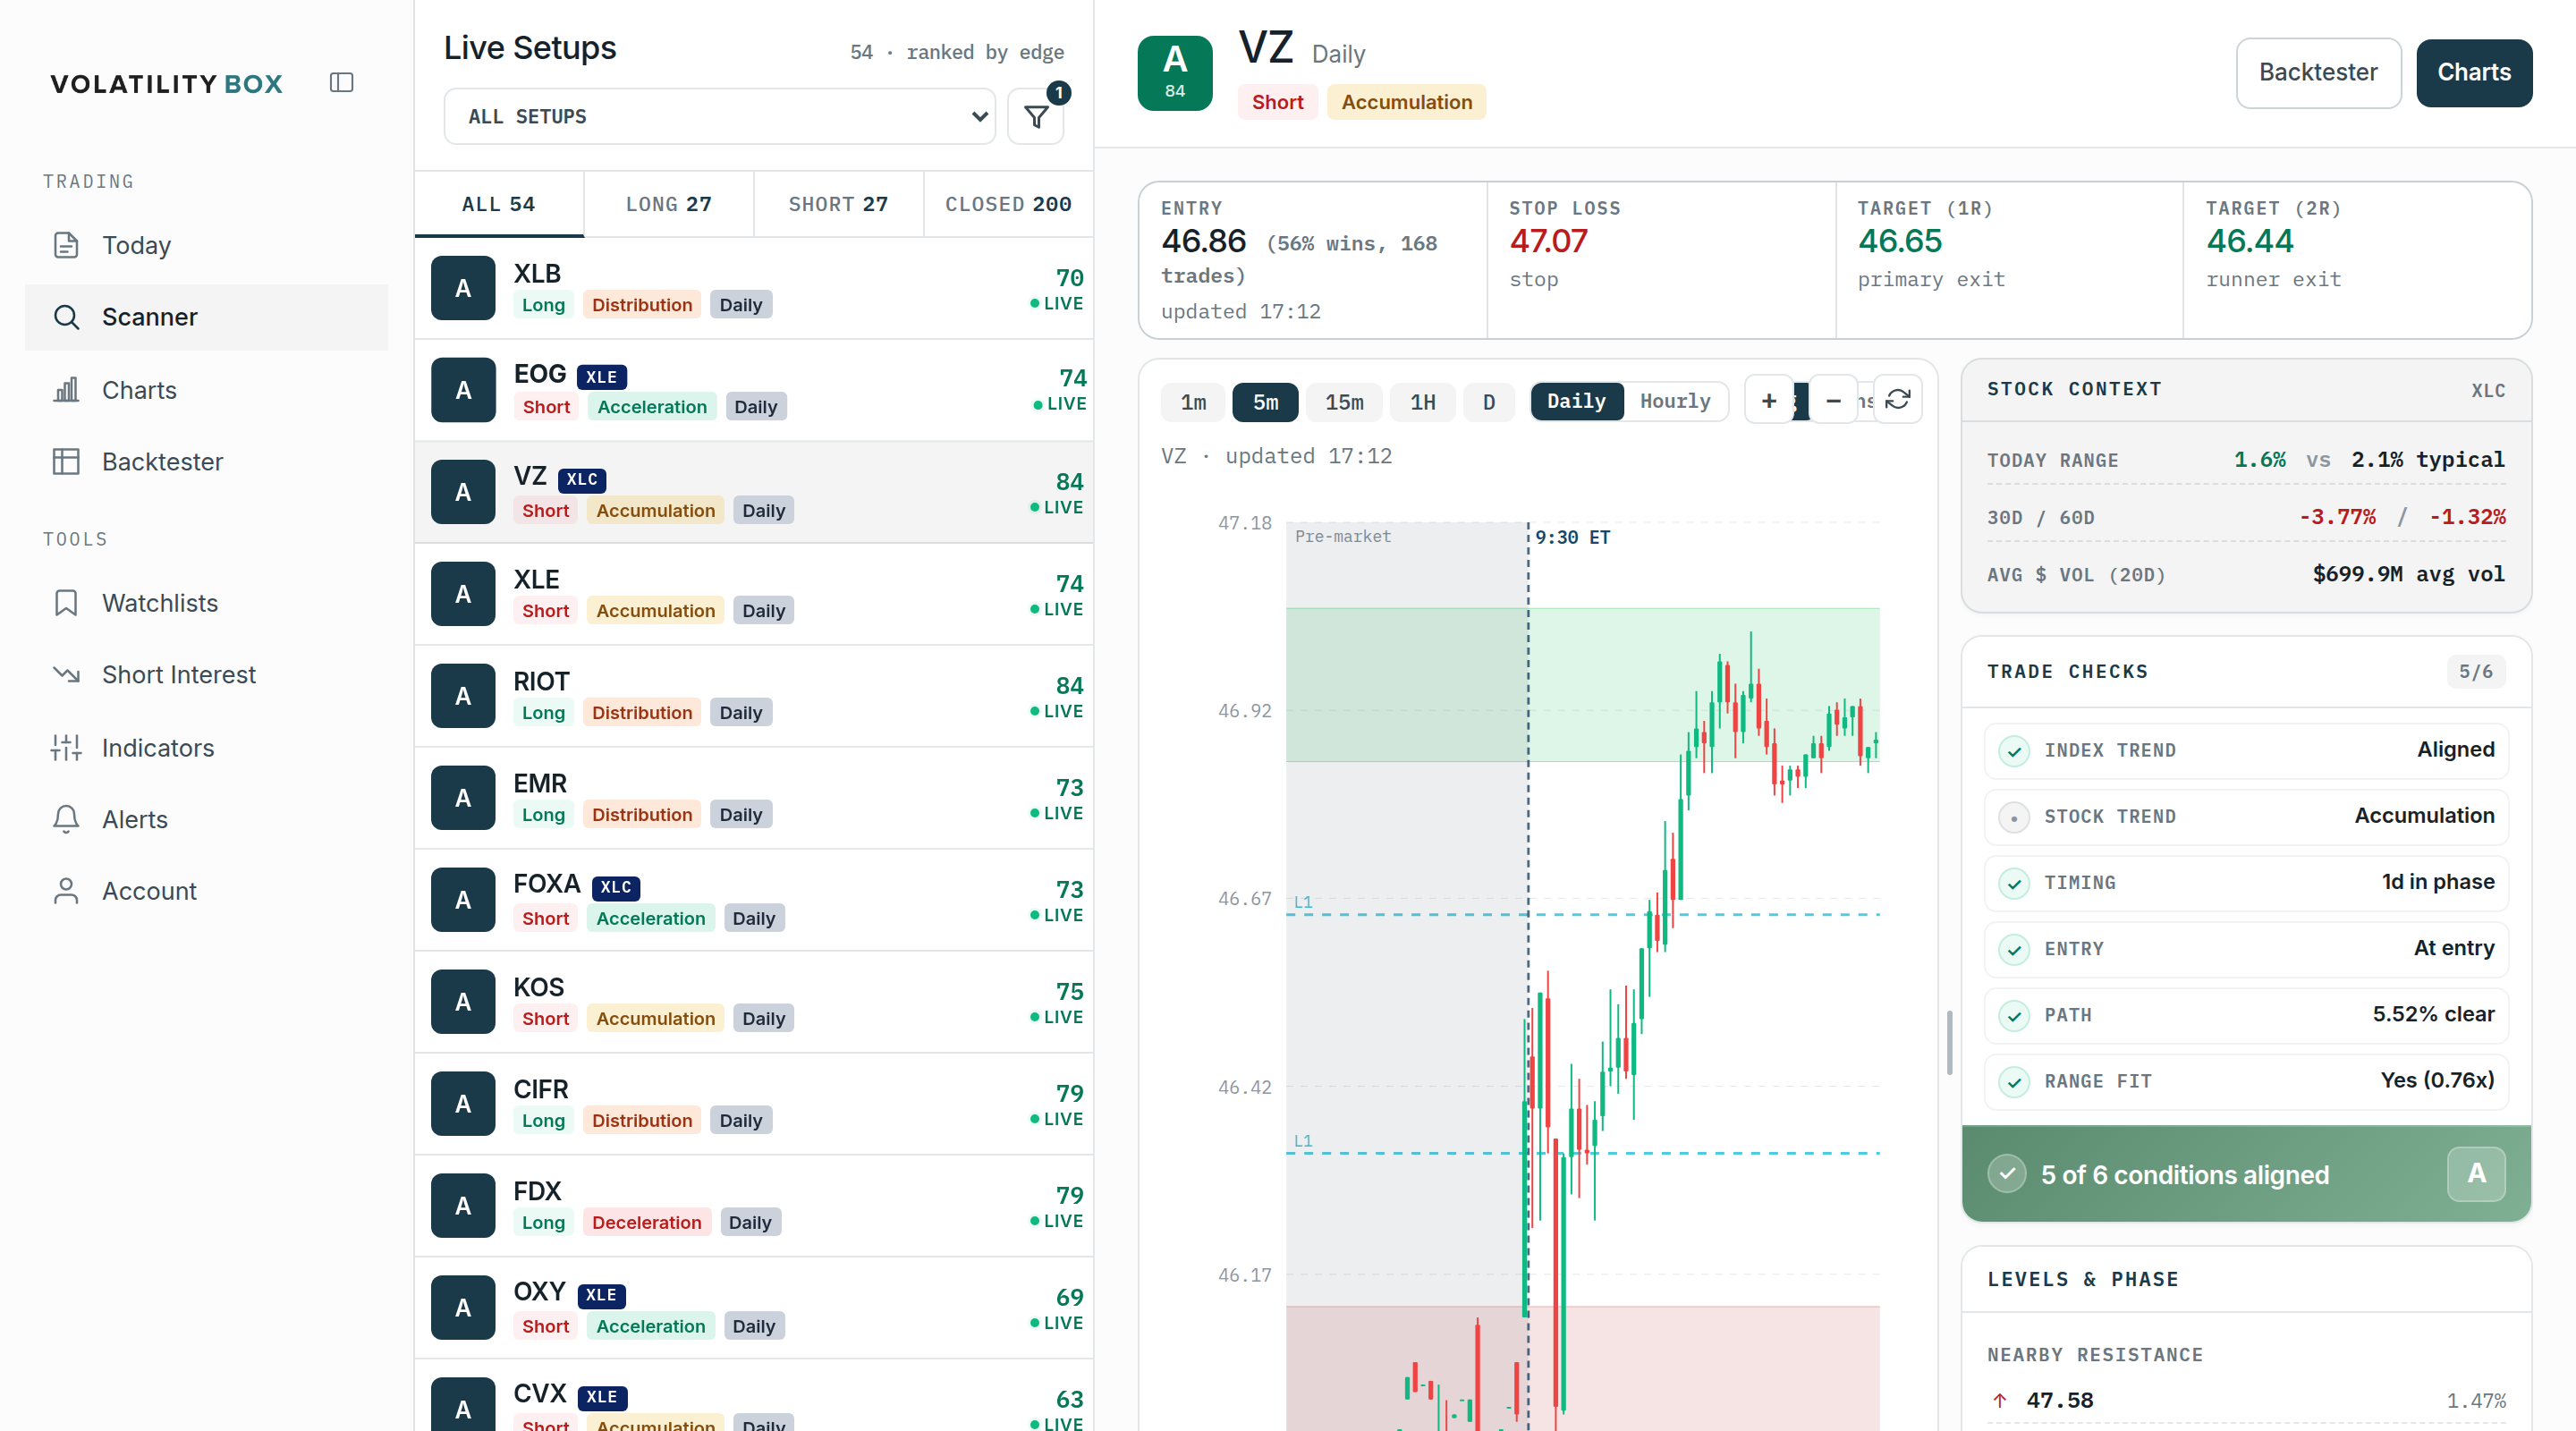
Example Counter-Trend Scanner Configuration
A complete counter-trend setup: Model Daily Conservative, prefer A or A+ grade, Market Pulse Alignment AGAINST, a positive Win Rate filter, Expectancy +$0.30+, Direction Both, Status Open, Time last 4 hours, Volume 1M+. This ultra-selective configuration leaves only a handful of candidates, and even then the hit rate stays below with-trend setups, so the edge lives in expectancy and disciplined risk-reward.
Confirmation Requirements Beyond the Scanner
Do not enter on a Scanner signal alone, even with perfect filters. You need reversal confirmation on the chart first: is price actually reversing, or just bouncing before continuing the trend? The cleanest confirmation is the Edge Signal arrow plus a sharp rejection at the cloud.
Bullish Reversal Confirmation (Counter-Trend LONG)
For a long-side breach against a downtrend, look for these on the Symbol Page chart: a sharp rejection candle (hammer or bullish engulfing) right at the lower orange cloud, showing rejection of lower prices; a volume spike to at least 1.5x average on the reversal candle; a green Edge Signal arrow printing at the extreme; and ideally the 3/8 EMA momentum cross turning up as the final tick. The more of these that align, the more the bounce looks like a genuine V-shaped reversal rather than a pause.
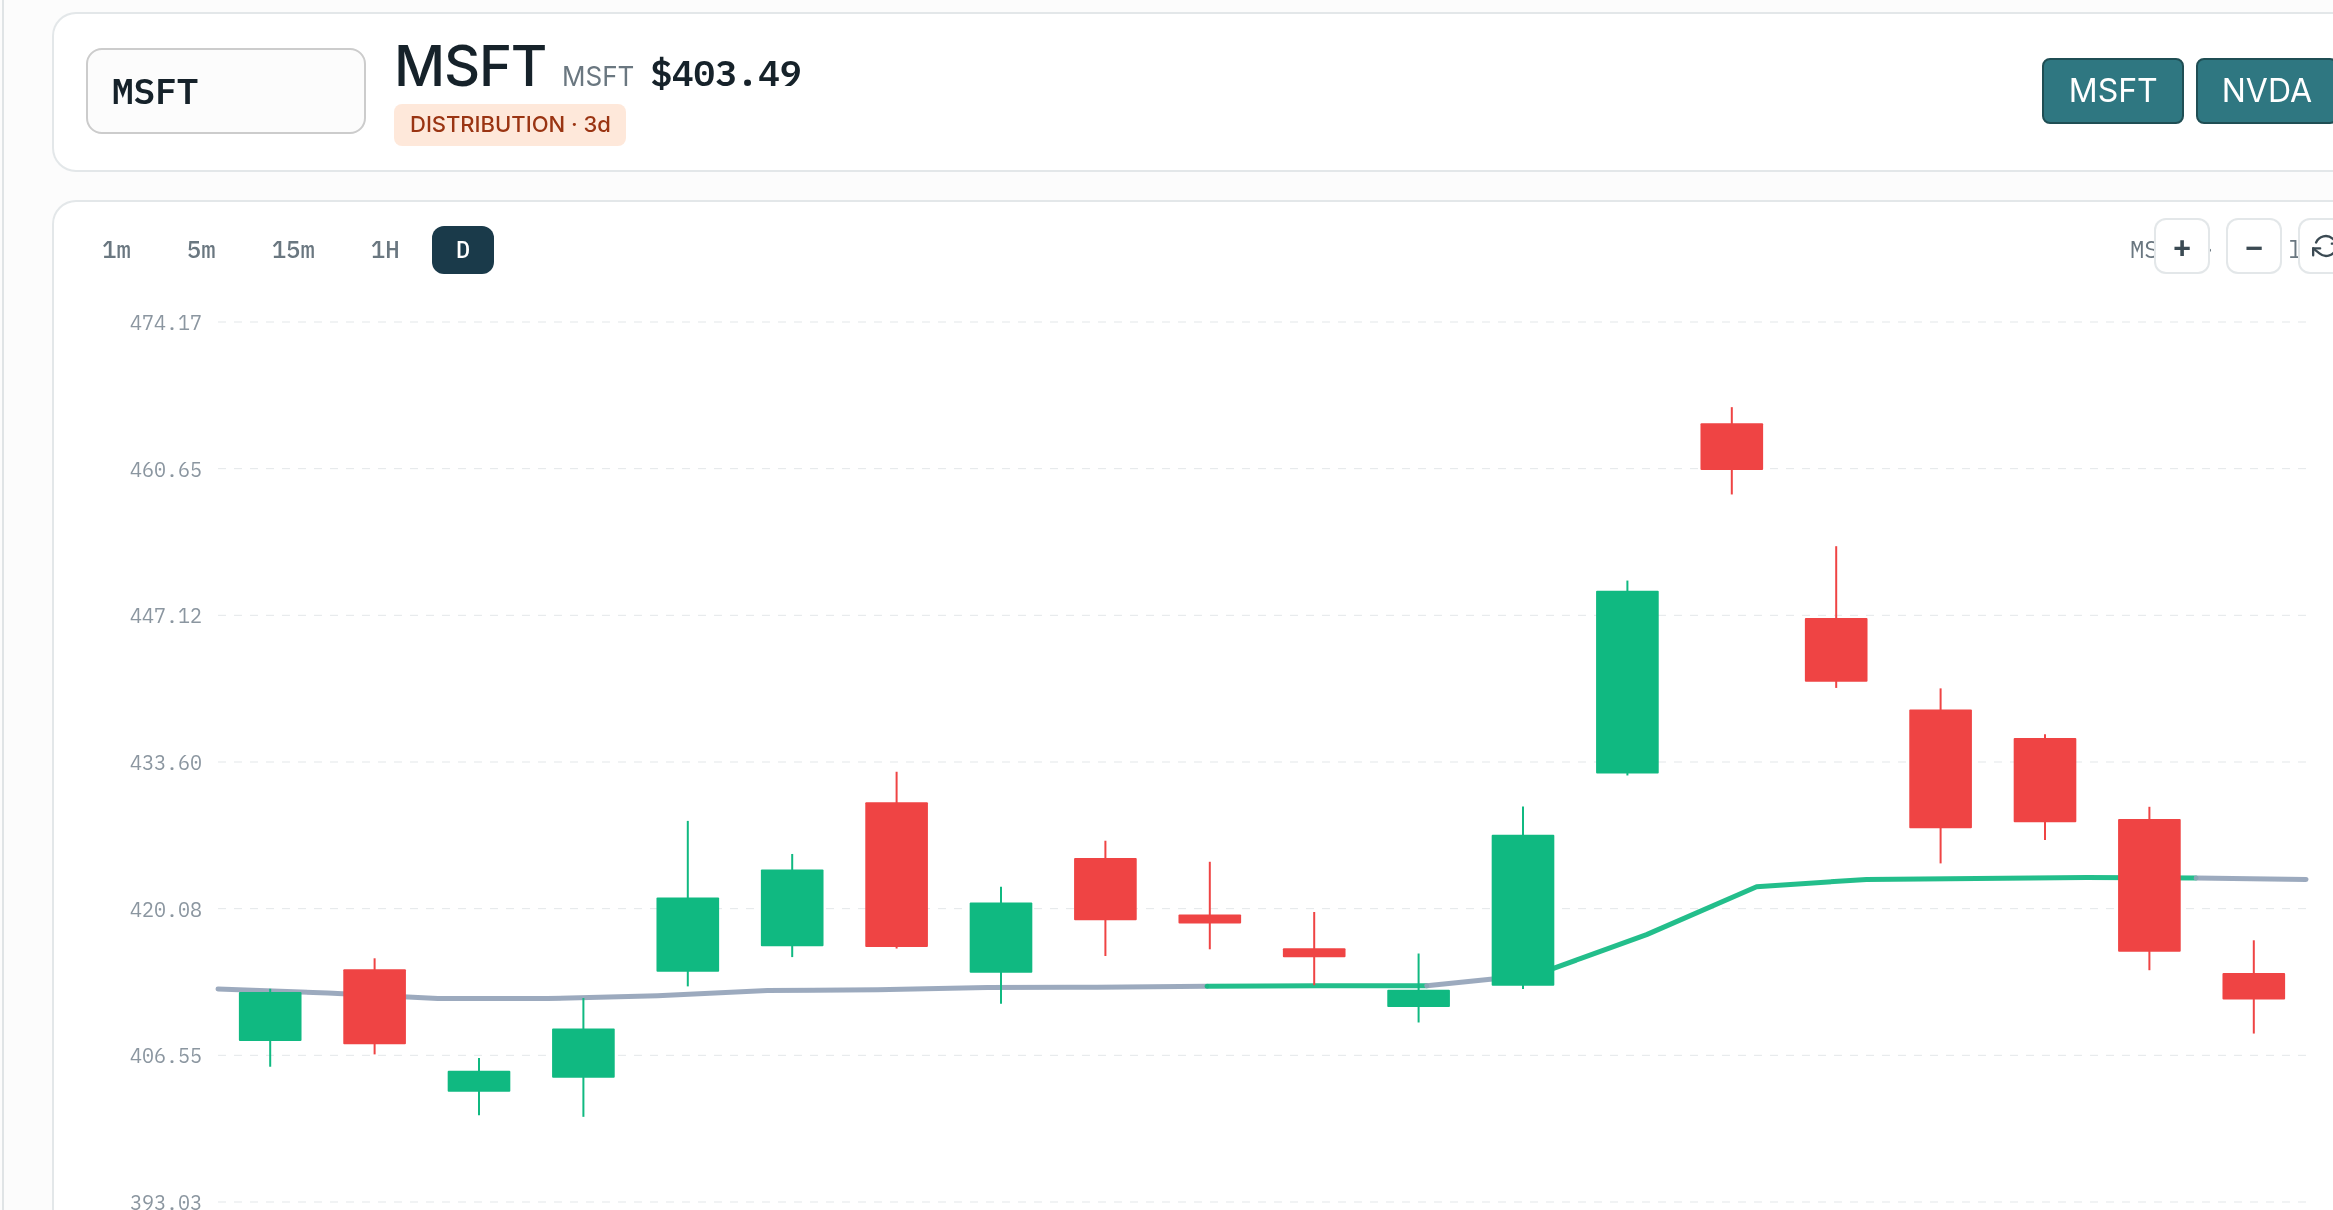
Example: MSFT counter-trend LONG. A long-side breach prints at the lower orange cloud near $421.20 with AGAINST alignment and high conviction. On the Symbol Page, a hammer candle forms with a long lower wick to $420.80 and closes at $422.40, showing buyers rejecting lower prices. Volume comes in 1.8x average, a green Edge Signal arrow prints, and the momentum cross turns up. Confirmation aligns, so you enter LONG at $422.50 with a volatility-sized stop just outside the cloud and a target back toward the middle of the range.
Bearish Reversal Confirmation (Counter-Trend SHORT)
For a short-side breach against an uptrend, mirror it: a shooting star or bearish engulfing candle at the upper green cloud, a volume spike on the distribution candle, a red Edge Signal arrow, and the momentum cross turning down. Without the rejection candle and the Edge Signal aligning, skip the trade. Counter-trend leaves no margin for error, so meet every confirmation before entry.
Position Sizing for Counter-Trend Trades
Use 50% of your normal position size on all counter-trend trades to account for the lower hit rate. If a standard with-trend trade risks 2% of the account, a counter-trend trade should risk only 1%, even at high conviction. This keeps losing streaks from damaging the account despite the reduced hit rate.
Example: a $20,000 account normally risks $400 (2%) with-trend. Counter-trend, risk $200 (1%). If entry is $192.80 and the volatility-sized stop is $195.20, the stop distance is $2.40, so position size is $200 / $2.40 = 83 shares. The halved size protects you from the higher failure rate while still allowing a meaningful profit if the reversal works.
Limit yourself to two counter-trend trades per day. If both fail, stop counter-trend for the week and refocus on with-trend setups. Track counter-trend results separately in your journal, and if they turn consistently unprofitable, stop for 30 days.
Risk-Reward Requirements
Counter-trend trades need better risk-reward to offset the lower hit rate, with 2:1 as the bare minimum, regardless of how attractive the setup looks. The math demands it.
Why 2:1 matters: at a low win rate with 2:1 over 10 trades, suppose you win 4 and lose 6. Winners make 4 x $200 = $800; losers cost 6 x $100 = $600. Net +$200, or +$20 per trade expectancy. At 1:1 with the same split you would lose $200 over 10 trades, turning a marginal edge into a losing strategy. This is the expectancy-over-hit-rate lesson in numbers: you can lose more often than you win and still come out ahead, but only if the winners are big enough.
Verify the ratio manually. For a counter-trend LONG: (Target – Entry) / (Entry – Stop) must be 2.0 or higher. For a SHORT: (Entry – Target) / (Stop – Entry) must be 2.0 or higher. If it is under 2:1, skip the trade or extend the target.
Volatility-Sized Stops, So You Are Not Chopped
The single biggest reason counter-trend traders bleed out is stops that are too tight for the conditions. A fixed-dollar stop has no idea how volatile the name is right now; it gets clipped by ordinary fluctuation, you take the loss, and then the reversal works without you. The fix is to size the stop to volatility, off the clouds, so normal noise cannot chop you out before the setup has a chance to develop.
Practically, that means placing the stop just outside the outer edge of the cloud on the breach you faded, or just beyond the rejection candle on a sharp V, whichever is appropriate for the depth of the breach. Conservative daily models give you the room to do this; hourly models are often too tight for counter-trend, where price whipsaws before reversing. The discipline is: give the trade volatility-appropriate room up front, but if price makes a clean new extreme beyond your stop, the reversal has failed, so exit without hesitation rather than widening it further.
Staged Exit Strategy
Counter-trend trades rarely travel the full distance, because the prevailing trend eventually reasserts itself. Taking profits earlier locks in gains before that happens. Use a three-stage exit: exit the first 50% at 1.5:1, the next 25% at 2:1, and let the final 25% run toward the opposite cloud (the model’s expected full reversal) or trail it manually.
Example with 200 shares: enter AAPL counter-trend LONG at $182.10, stop at $180.20 ($1.90 risk, $380 total). Target 1 at $184.95 (1.5:1) exits 100 shares for +$285. Target 2 at $185.90 (2:1) exits 50 shares for +$190. Target 3 at $187.20 (the opposite cloud) exits the final 50 for +$255. Total +$730, averaging $3.65 per share. Staging improves the odds of capturing gains versus holding for one far target.
When to Avoid Counter-Trend Entirely
Skip counter-trend completely when reversals are extremely low probability. When the clouds compress or invert, volatility is too high, the high-to-low range has blown past twice normal, and you should sit out or trade only with the obvious pressure rather than fade it. Avoid counter-trend when earnings are within a few days, since gaps blow straight through any stop. Lean on the conservative models around earnings and FOMC, where you lean conservative anyway.
Do not fade strong news catalysts, shorting a 5% gap up on great news or buying a 5% gap down on terrible news. Momentum runs over technical levels after catalysts. Wait until a trend has matured before fading it; fresh, strong trends are the hardest to reverse. And if you are on a losing streak with any strategy, stick exclusively to with-trend setups until you regain consistency, replacing willpower and revenge trading with the data. Never fade on weak-grade setups, no exceptions.
Real-World Counter-Trend Example
SPY presents a short-side counter-trend opportunity. Scanner configured Daily Conservative, A/A+ preferred, AGAINST alignment, Win Rate filter, Both directions, Open. SPY had rallied eight straight days into clear overextension, far from the Market Pulse line, exactly the distance clue that flags a sharper reversal. Market Pulse held in its long-leaning Accumulation stage, so this is a true counter-trend fade.
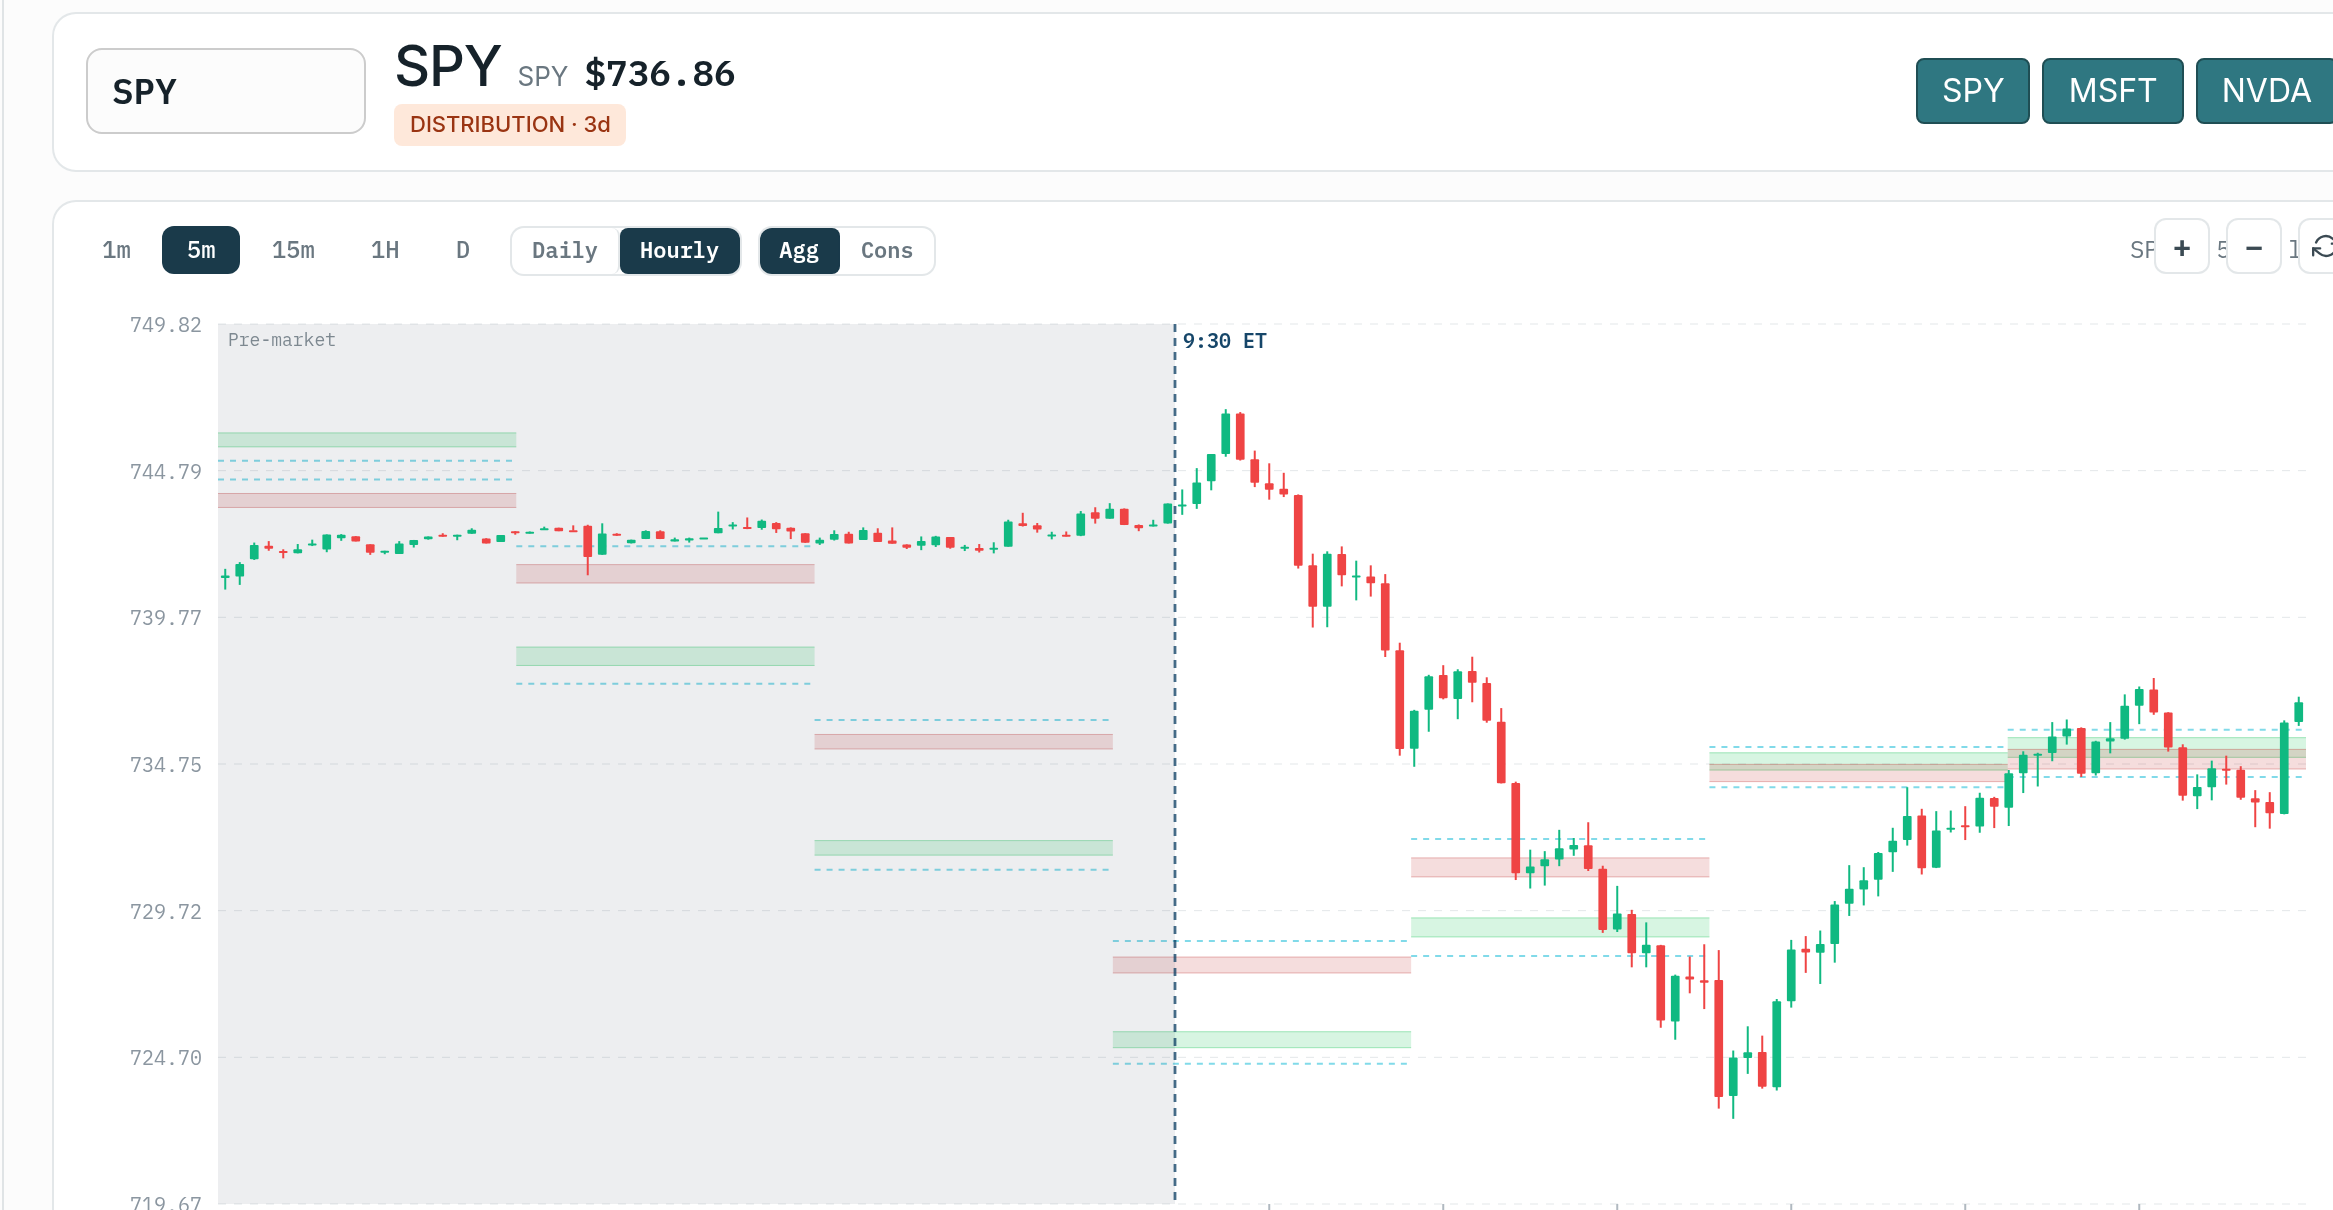
Symbol Page verification: price pushed into the upper green cloud and printed a shooting star at $480.50 with a long upper wick to $481.20. Volume came in 2.1x average, a red Edge Signal arrow printed, and the momentum cross turned down, the final tick on the reversal. Confirmation aligned.
Position sizing: $50,000 account, 1% counter-trend risk = $500. Volatility-sized stop just above the shooting star high at $481.40, stop distance $1.40, so $500 / $1.40 = 357 shares, round to 350.
Execution: SHORT 350 at $480.00, stop $481.40 ($490 risk). Staged targets at 1.5:1, 2:1, and a trail toward the lower cloud. In this illustration, exiting in stages as price worked lower returns about a 2:1 result on the $490 risk, showing how the expectancy edge, rather than a high hit rate, is meant to do the work. The figures here are a worked example of the math, not a recorded trade or a projected outcome.
Counter-Trend Checklist
Before any counter-trend trade, verify every item, no exceptions:
- Scanner shows high conviction with A/A+ grade.
- Market Pulse Alignment is AGAINST, and price is far from the Market Pulse line.
- Risk-reward is 2:1 or better, calculated manually.
- A sharp rejection candle formed at the cloud (hammer, shooting star, engulfing).
- Volume spiked 1.5x average on the reversal candle.
- The Edge Signal arrow printed in the trade’s direction.
- The 3/8 EMA momentum cross is turning (the final tick).
Position size is 50% of normal (1% account risk max). The stop is volatility-sized just outside the cloud or the reversal candle, never a fixed arbitrary distance. Staged targets are defined at 1.5:1, 2:1, and a trail before entry. Clouds are not compressed or inverted, no earnings within a few days, no strong news catalyst, and you are not on a losing streak. If any single item is unchecked, take a with-trend setup instead.
Summary and Next Steps
Counter-trend trading with the Volatility Box requires ultra-selective filtering: Daily Conservative model, A/A+ grade, AGAINST alignment with price far from the Market Pulse line, a Win Rate filter, and +$0.30 expectancy. Even then the hit rate stays below with-trend setups, so the edge comes from expectancy and disciplined risk-reward, not a high win rate.
Always confirm reversals on the chart first: rejection candle at the cloud, volume spike, Edge Signal arrow, momentum cross. Without them, skip it. Use 50% position sizing, volatility-sized stops just outside the cloud or candle so you are not chopped, and staged exits at 1.5:1, 2:1, and a trail.
Avoid counter-trend entirely when the clouds compress or invert, around earnings, on strong catalysts, on fresh trends, or during personal losing streaks. Require 2:1 minimum risk-reward, no exceptions. Most successful traders make the majority of their profit with the trend; counter-trend is optional even for experienced traders.
Related
Educational content only. The examples and numbers above are illustrations, not predictions, recorded results, or financial advice.
Was this article helpful?
Still need help?
Can't find what you're looking for? Our support team is here to help.
Contact Support