Generate the ThinkOrSwim studies
The Indicator Generator builds the Volatility Box study files you import into ThinkorSwim to plot the models on your charts. It produces the weekly bundle that covers about 115 liquid symbols, and it generates one-off files for any watchlist you choose.
Watch: Part 9 of the Volatility Box onboarding series.
Before you start
- You are logged in to the platform and on the Indicator Generator page.
- ThinkorSwim desktop, for importing the files later. Importing is a desktop action.
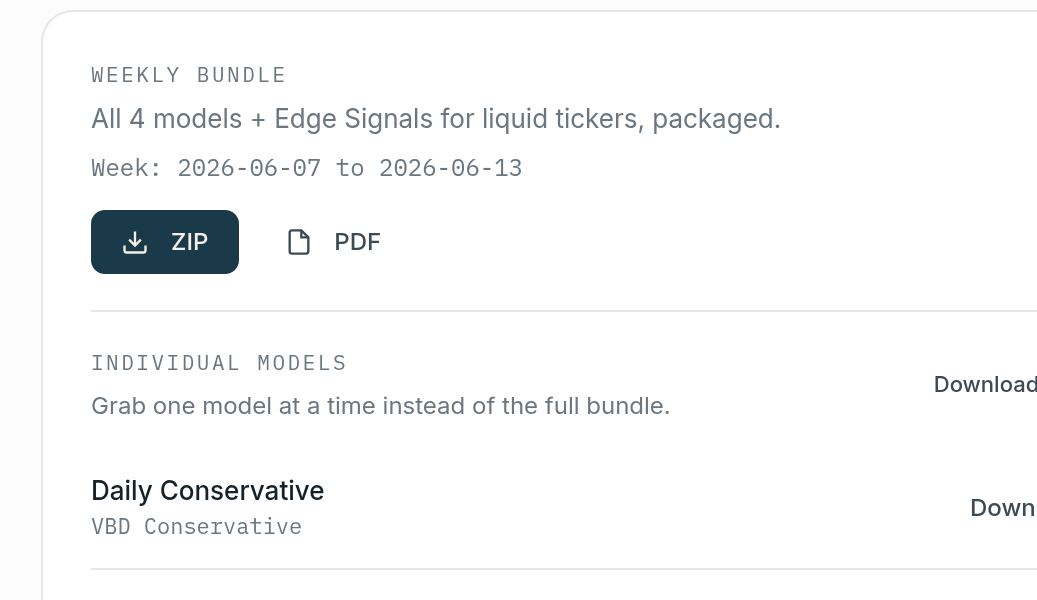
The weekly bundle
On the right of the Indicator Generator is the weekly bundle. It covers about 115 liquid stock names and is regenerated every week. This is the same default file set used to run the models, made available for download.
The bundle is four study files, not one file per symbol:
ti_vbd, aggressive and conservative: the Daily models.ti_vbh, aggressive and conservative: the Hourly models.
Those four files carry every symbol in the bundle. The .zip also includes a PDF listing the symbols covered that week.
Why about 115 symbols
The models support more symbols than the bundle holds. The cap comes from ThinkorSwim, where performance starts to stagnate past roughly 100 symbols in a file. The bundle is pushed to 115 using some packing tricks. If you build your own file, keep it near 100 symbols or fewer so it stays responsive in ThinkorSwim.
Downloads are unlimited. There is no reason to cram symbols into one file to make it count. Generate as many smaller, focused files as you want.
Step 1: Confirm the week, then download the bundle
- Check the week date range shown next to the bundle. It tells you which week the models are built for.
- Click the blue zip icon to download the bundle.
- Unzip it. On a Mac, double-click the folder. On Windows, right-click and choose Extract All.
Inside are the four .study.ts files and the symbol PDF. Do not double-click a .ts file. ThinkorSwim reads it on import, but your computer does not recognize the format and may try to play it as a video.
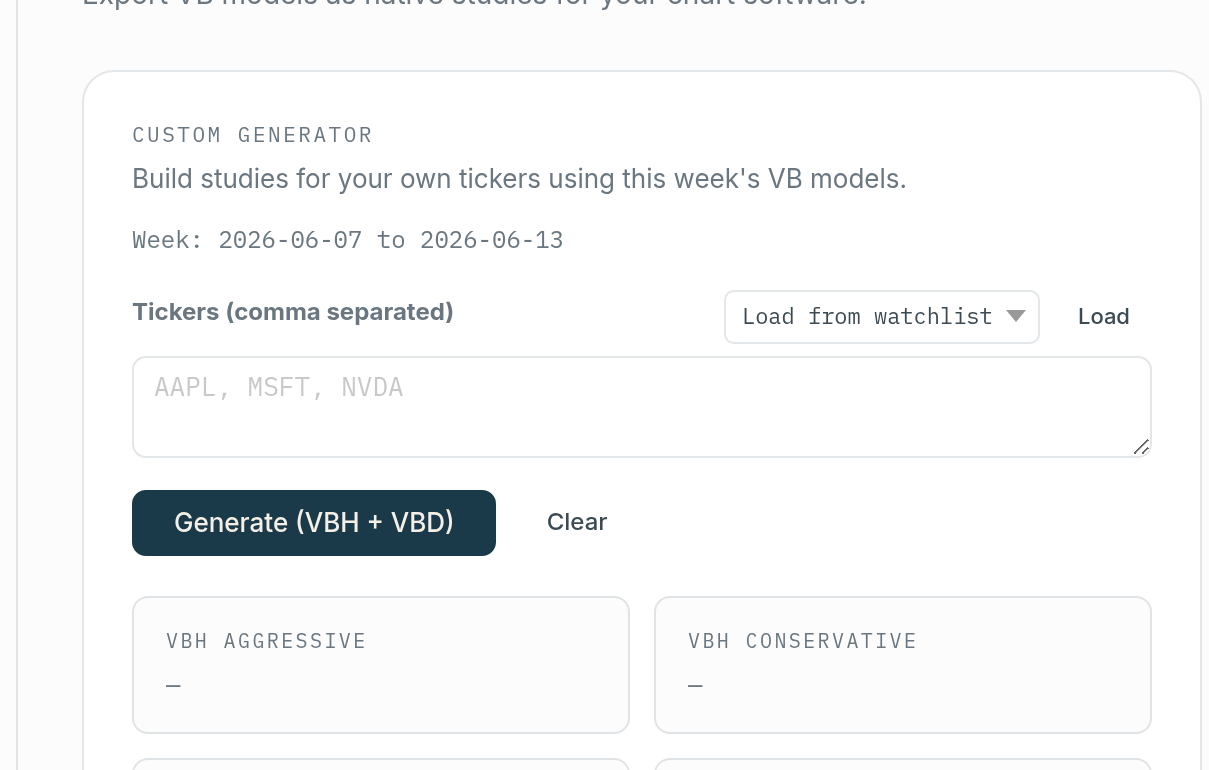
Step 2: Generate a one-off file for a watchlist
To plot a symbol that is not in the bundle, generate it from a watchlist.
- Open the watchlist dropdown and select a list, for example your Favorites.
- Click Generate.
- You get four study files covering every symbol on that list.
- Click the download link to save them.
Add or remove symbols and click Generate again to rebuild the file. A single name works the same way: put it on a list, generate, download.
One-off files do not overwrite the bundle
One-off files are given slightly unique names, so importing them into ThinkorSwim does not replace the pre-generated bundle. Your custom file sits alongside the default four files instead of clobbering them. You can keep the weekly bundle imported and still add a one-off for a name that just showed up on the Scanner.
Verify it worked
Open ThinkorSwim, import the files (see Install the ThinkOrSwim studies), and load a symbol that is in the file. The bands plot over price. The green cloud above price marks the short zone; the orange cloud below price marks the long zone.
Troubleshooting
- Nothing plots. The symbol is not in any file you imported. Load a symbol from the bundle PDF, or generate a one-off file for that symbol. A symbol with no file plots nothing, which is expected.
- The file opens as a video or as text. You double-clicked the
.tsfile. Import it through the Studies panel instead of opening it directly. - The levels look stale. The bundle is built by week. If the week range on the page has moved past the file you imported, download the current bundle.
Related
Was this article helpful?
Still need help?
Can't find what you're looking for? Our support team is here to help.
Contact Support