Platform Overview
The Volatility Box is a set of counter-trend volatility models that map where price is statistically likely and unlikely to go given current volatility and market regime, plotted as cloud zones on the chart. This article explains what the models do and what each page is for. Later articles in the series cover each page in depth.
Watch: Part 1 of the Volatility Box onboarding series.
What the models do
The models study how each market moves, what its volatility is doing, what regime it is in, and where price is statistically likely to go. They plot that as two cloud zones over price:
- Orange cloud, below price: the long entry zone. A long fires when price drops into the lower cloud, a counter-trend pullback, not an upside breakout.
- Green cloud, above price: the short entry zone, where price has stretched above its likely range.
A breach is the trigger: price tags at least the aggressive cloud. If the clouds compress or invert, volatility is running too high and the cleaner decision is usually to sit out. On top of the breach sit four confluence layers that grade the setup: the trend (the Market Pulse stage), the Edge Signal overbought and oversold read, the Keltner channel wedges, and the 3/8 EMA momentum cross.
Two model families
The Daily model prints one level per day. It is harder to hit and carries more weight, suited to swing trades of one to five days. The Hourly model prints intraday levels for more frequent setups. Each comes in an Aggressive and a Conservative variant. The conservative variant suits high-volatility events such as earnings and FOMC.
The pages
The platform is the model output made readable. It lives in the left-hand navigation. The pages, in the order they are used:
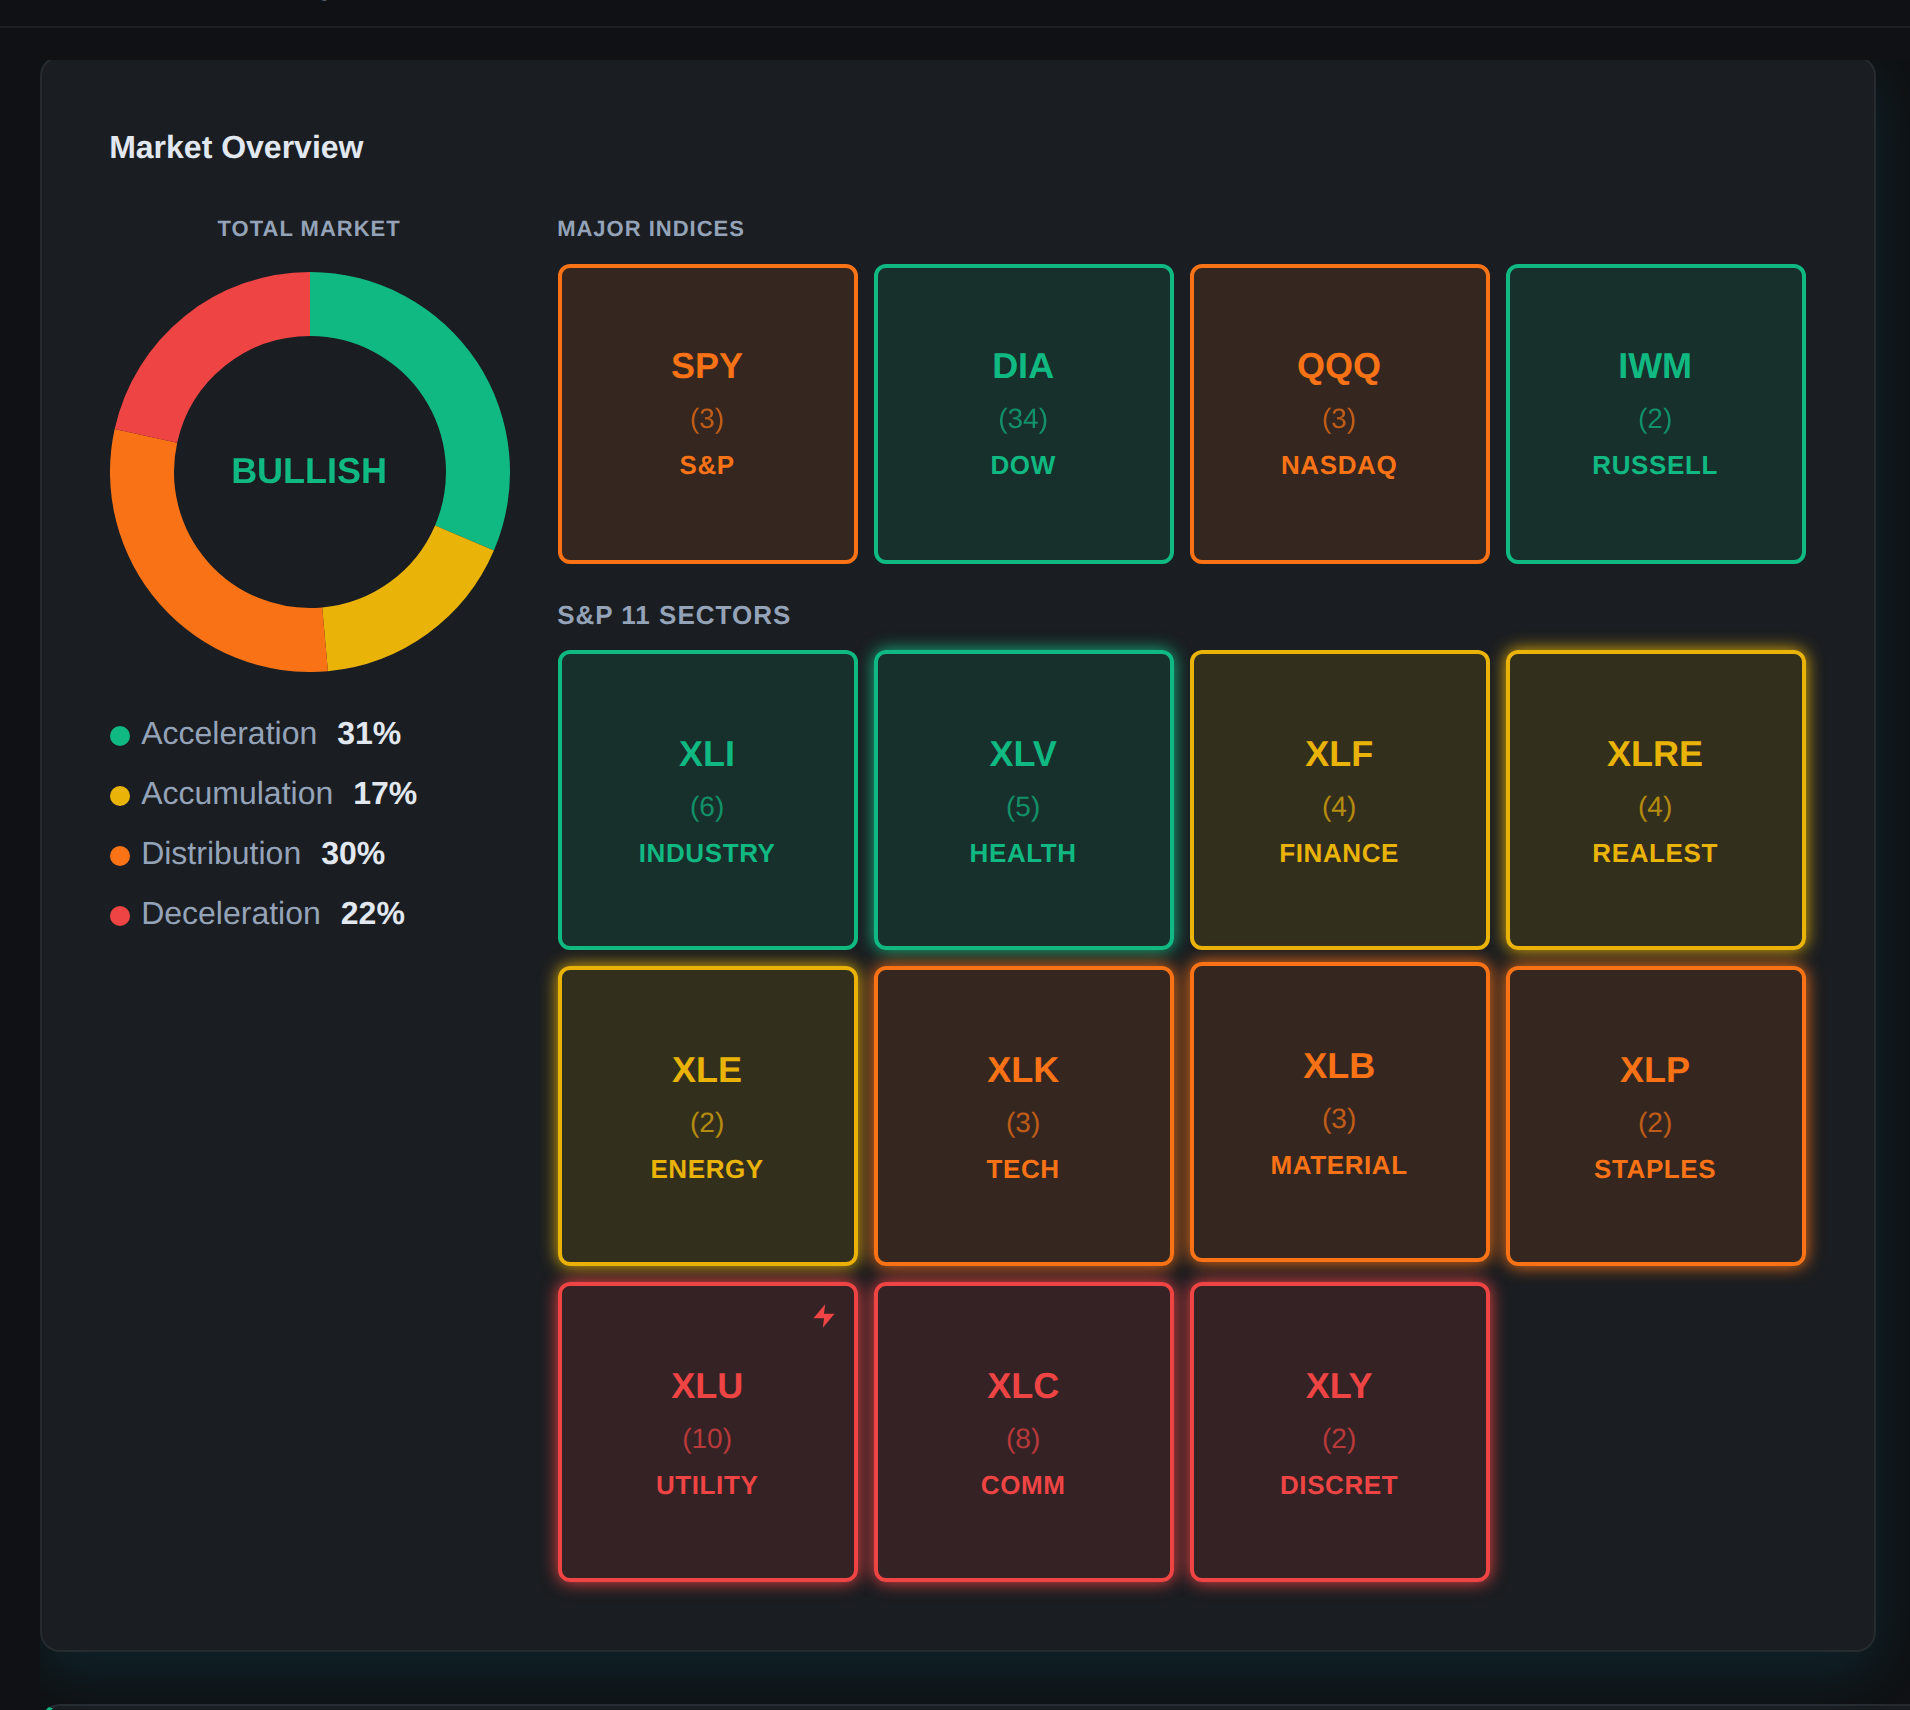
Today
The model’s read on the entire market: a one-sentence snapshot, breadth, range, the leading sector, the four index markets by stage, sector rotation, where to focus longs and shorts, and a shortlist of the day’s top setups. It answers whether today is worth trading and which direction to lean.
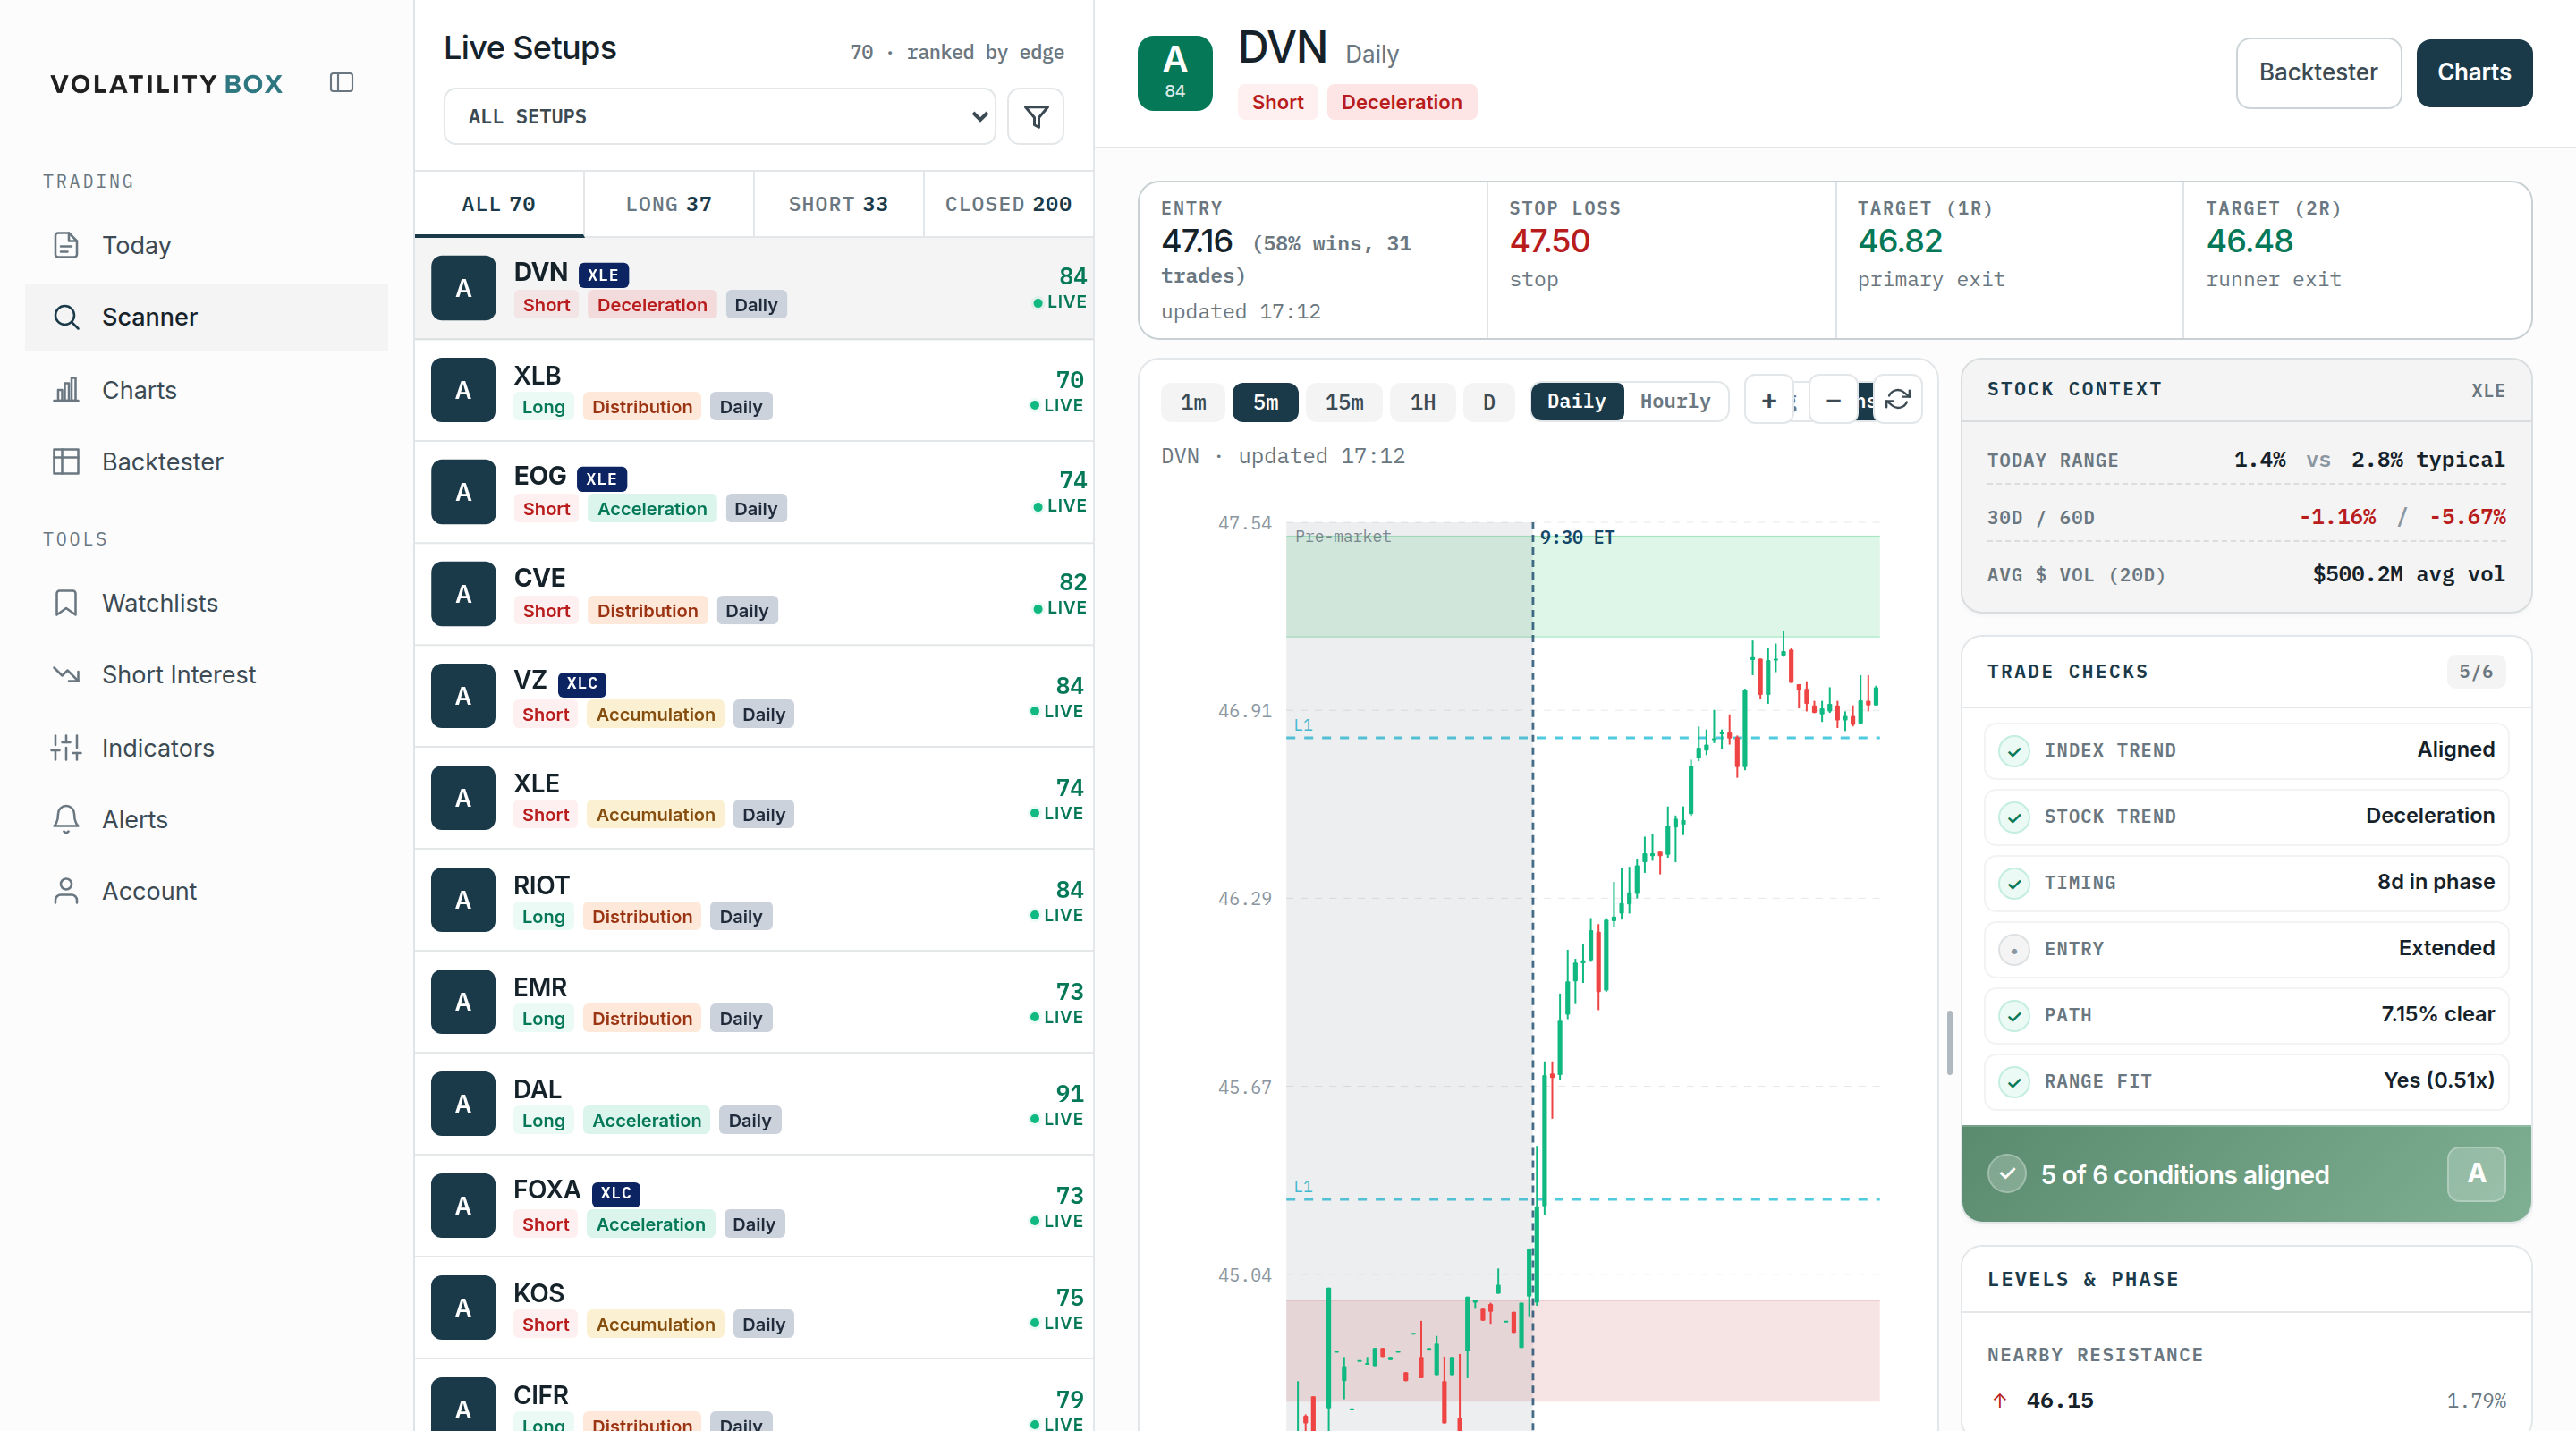
Scanner
The short list of names where the models say you have an edge right now, ranked by a letter grade so the strongest setups surface first. Most traders spend the bulk of their time here.
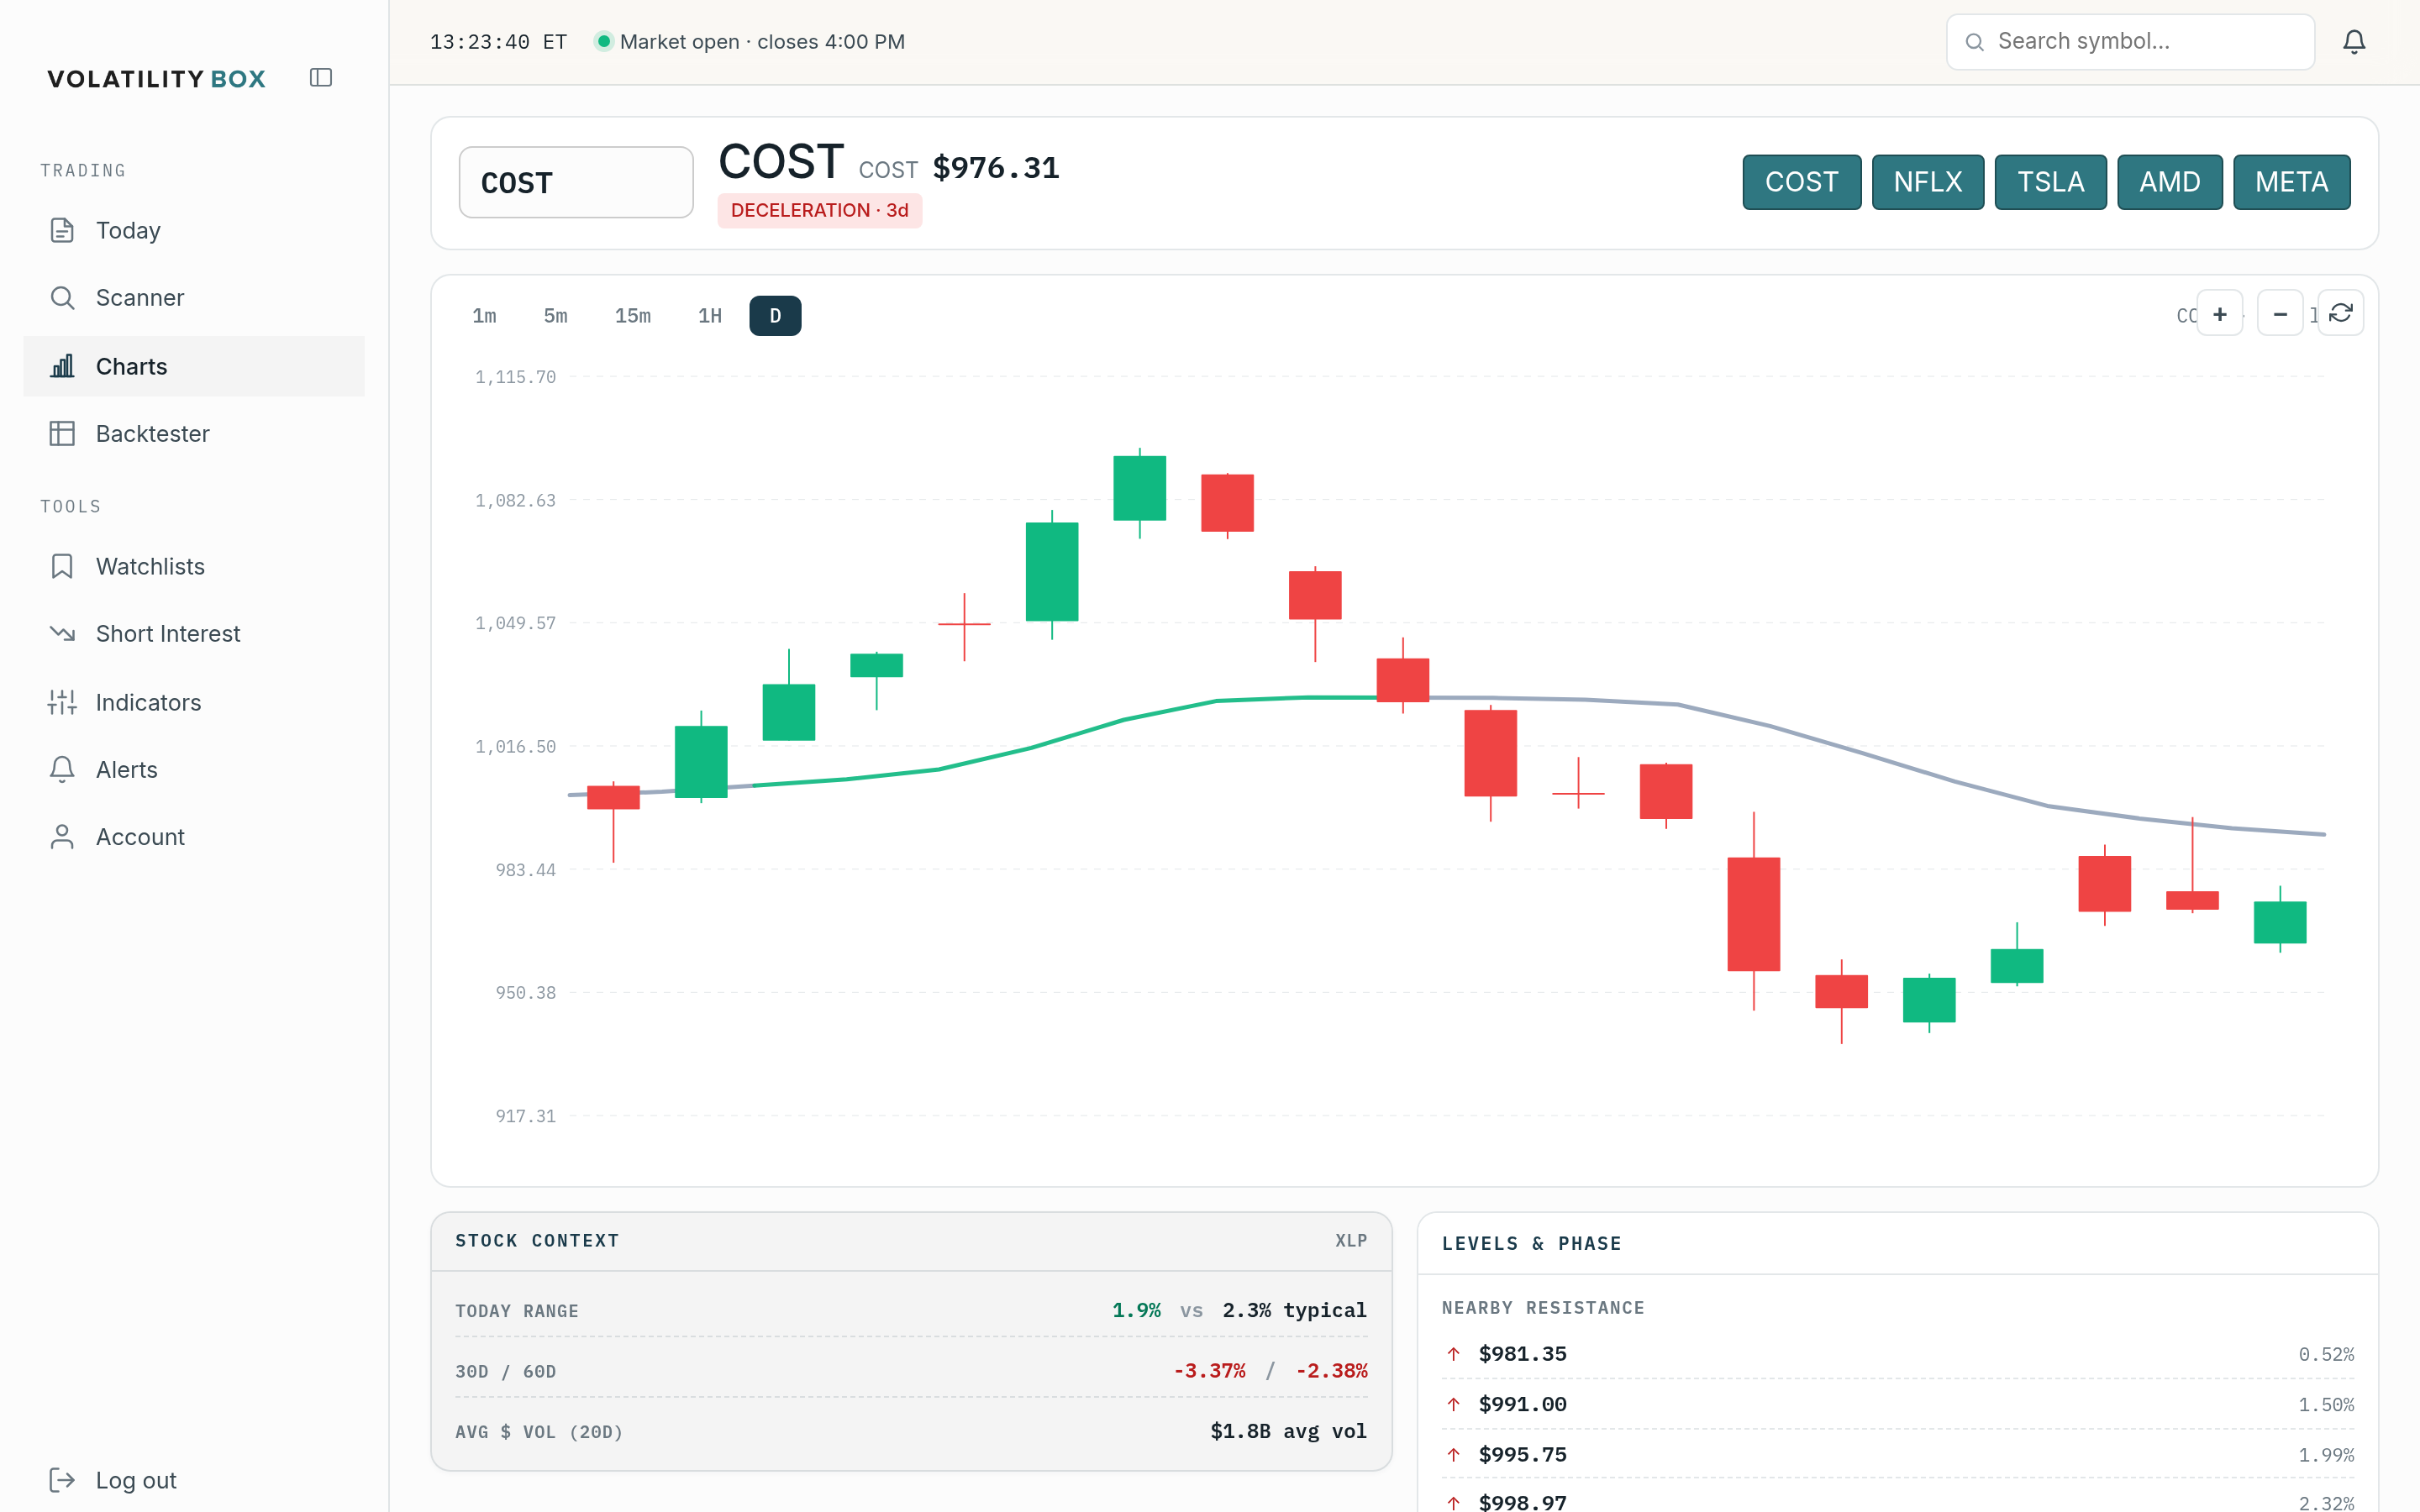
Charts
Puts the model’s expected range, the clouds and levels, on any symbol, so you can confirm a setup visually before acting.
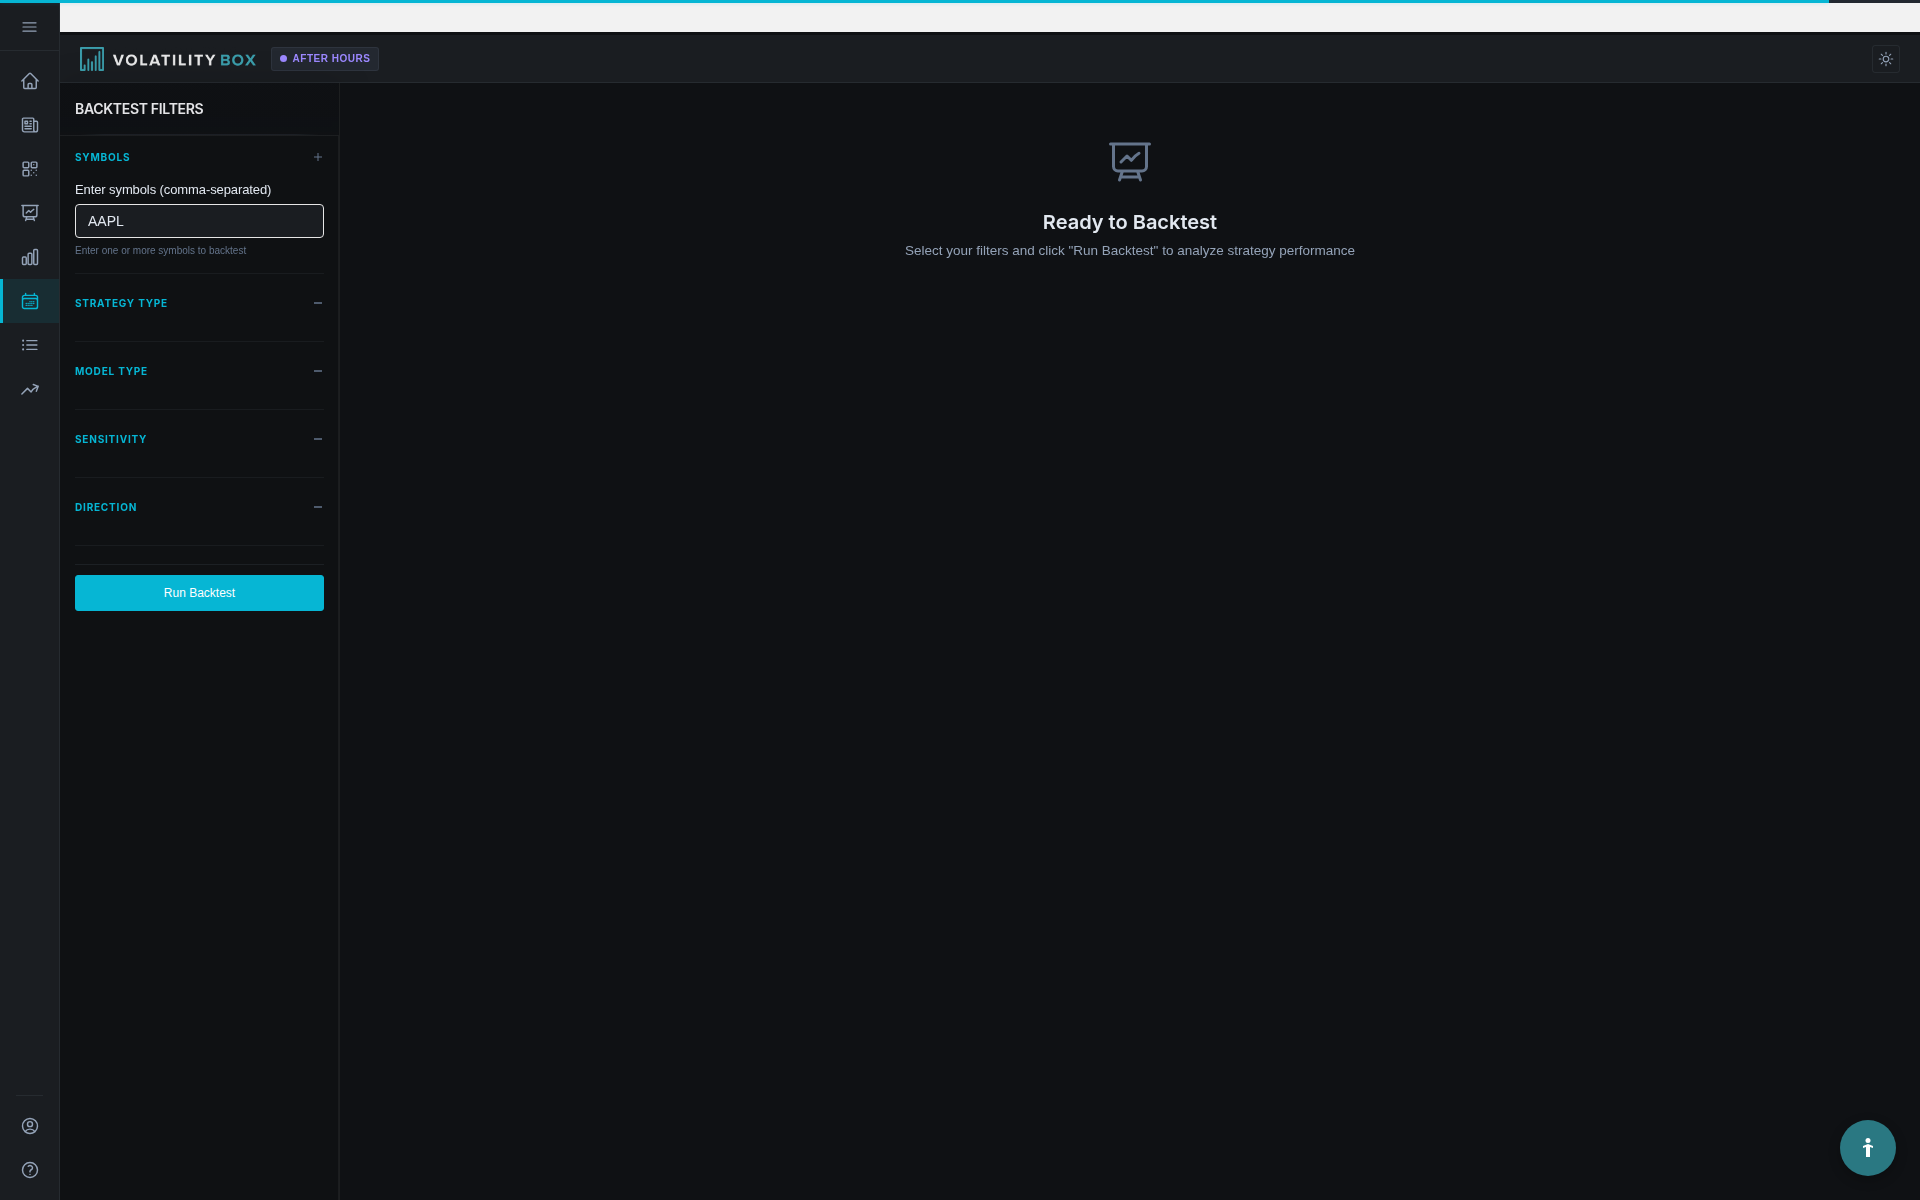
Backtester
Checks how the models have performed, going back several years: expectancy, profit factor, the cumulative P&L curve, and a trade-by-trade log. The shortlist numbers on the Today page and Scanner come from here.
Tools: Watchlists, Short Interest, Indicator Generator
Below the core pages: Watchlists organize the names you trade and filter the Scanner and Today page down to them. The Short Interest scanner surfaces names with high short interest. The Indicator Generator builds study files that plot the models on your thinkorswim charts.
Alerts
Sends a notification through Telegram when price is breaching the models in the markets you follow, so you do not have to watch the screen.
Important notes
The Volatility Box gives you a model of price and volatility, not buy or sell recommendations. No model wins every time; the edge shows up over a sample, through consistent execution and volatility-sized stops and targets. You own the risk management and the decision to take the trade.
Related
Was this article helpful?
Still need help?
Can't find what you're looking for? Our support team is here to help.
Contact Support