Weekly indicator updates
The models are recalculated every week, so the study files change each week too. Updating takes about thirty seconds: confirm the upcoming week, download the new bundle, and import the four files over the old ones.
Watch: Part 9 of the Volatility Box onboarding series.
Before you start
- You imported the four-file bundle at least once already. See Install the ThinkOrSwim studies for the first import.
- ThinkorSwim desktop is open.
Why the files change weekly
Each week the models are rebuilt on fresh data, so the cloud levels reflect current volatility heading into the new week. Last week’s file plots last week’s levels. Importing the new file keeps your entries, stops, and targets aligned with the levels the platform is showing now.
Step 1: Confirm the upcoming week
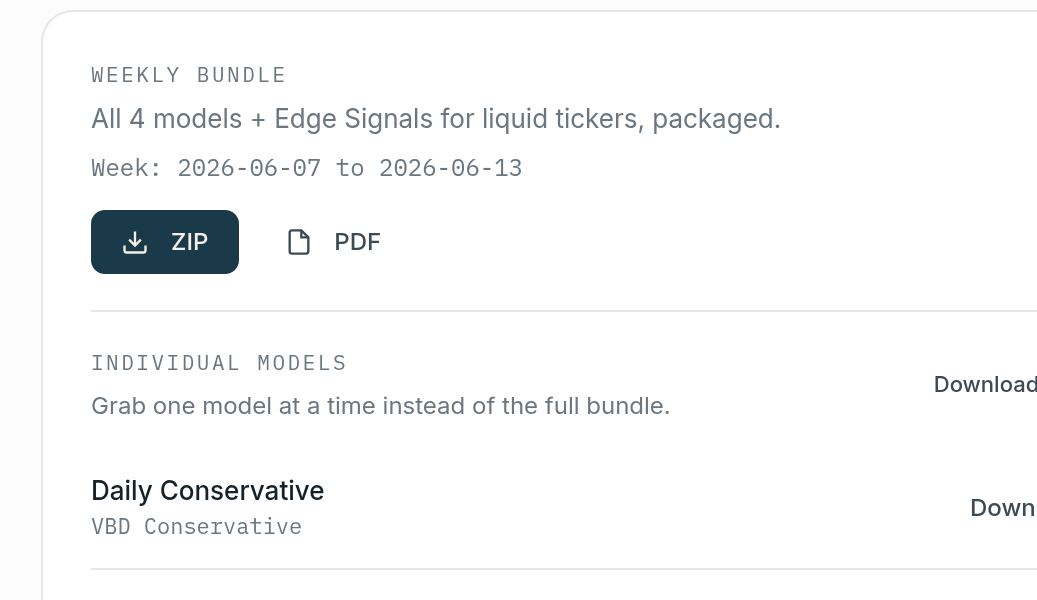
Open the Indicator Generator. Next to the weekly bundle is a week date range. Check that it matches the week you are about to trade. The range is how you confirm you are downloading the current models and not an older set.
Step 2: Download and unzip the bundle
- Click the blue zip icon to download the bundle.
- Unzip it. On a Mac, double-click the folder. On Windows, right-click and choose Extract All.
Inside are the same four .study.ts files as before: ti_vbd aggressive and conservative for the Daily models, ti_vbh aggressive and conservative for the Hourly models.
Step 3: Import and replace
- Click the Studies icon at the top right of ThinkorSwim.
- Click Import.
- Select all four
.tsfiles and click Open. - ThinkorSwim asks whether to replace each existing file. Click Yes, four times for the four files.
Clicking Yes overwrites last week’s files in place. Any study sets, styles, and chart settings already tied to those four studies carry over, so your charts update to the new levels without being rebuilt.
Verify it worked
Load a symbol from the bundle and confirm the bands plot. The week range on the Indicator Generator page is the reference: if you have downloaded and replaced the file for that range, your charts are current.
Troubleshooting
- ThinkorSwim did not ask to replace. On a first-ever import there is no prompt. From the second week on, the replace prompt appears for each file. If it does not, check that you selected the bundle files, which keep the same names week to week.
- The levels still look like last week. Confirm the week range on the page advanced before you downloaded, and that you clicked Yes to replace rather than skipping the prompt.
- A one-off file did not change. One-off watchlist files are named uniquely and are not part of the weekly bundle. Regenerate the one-off separately. See Watchlist bulk generation.
Related
Was this article helpful?
Still need help?
Can't find what you're looking for? Our support team is here to help.
Contact Support