VB backtesting
The backtester is the research tool in the platform for deciding whether to trust a setup and where on that setup to participate. The scanner hands you a signal; the backtester tells you what that signal has been worth historically on a given symbol.
Watch: Part 7 of the Volatility Box onboarding series.
A research lab, not a scoreboard
At its simplest the backtester is a scoreboard: it reports how a model performed on a symbol over its history. That view undersells it. Run the same name a few different ways and compare the results, and the differences become clues. They tell you where the edge lives on that stock, which model to lean on, and when a trade is quietly telling you to get out. Treat the page as a place to run experiments on the names you trade, not a single pass or fail grade.
Every backtest answers one question: how effective were the models on this symbol, and which model should you be using. You answer it by changing one variable at a time, daily against hourly, aggressive against conservative, long against short, and reading how the numbers move.
The two headline metrics
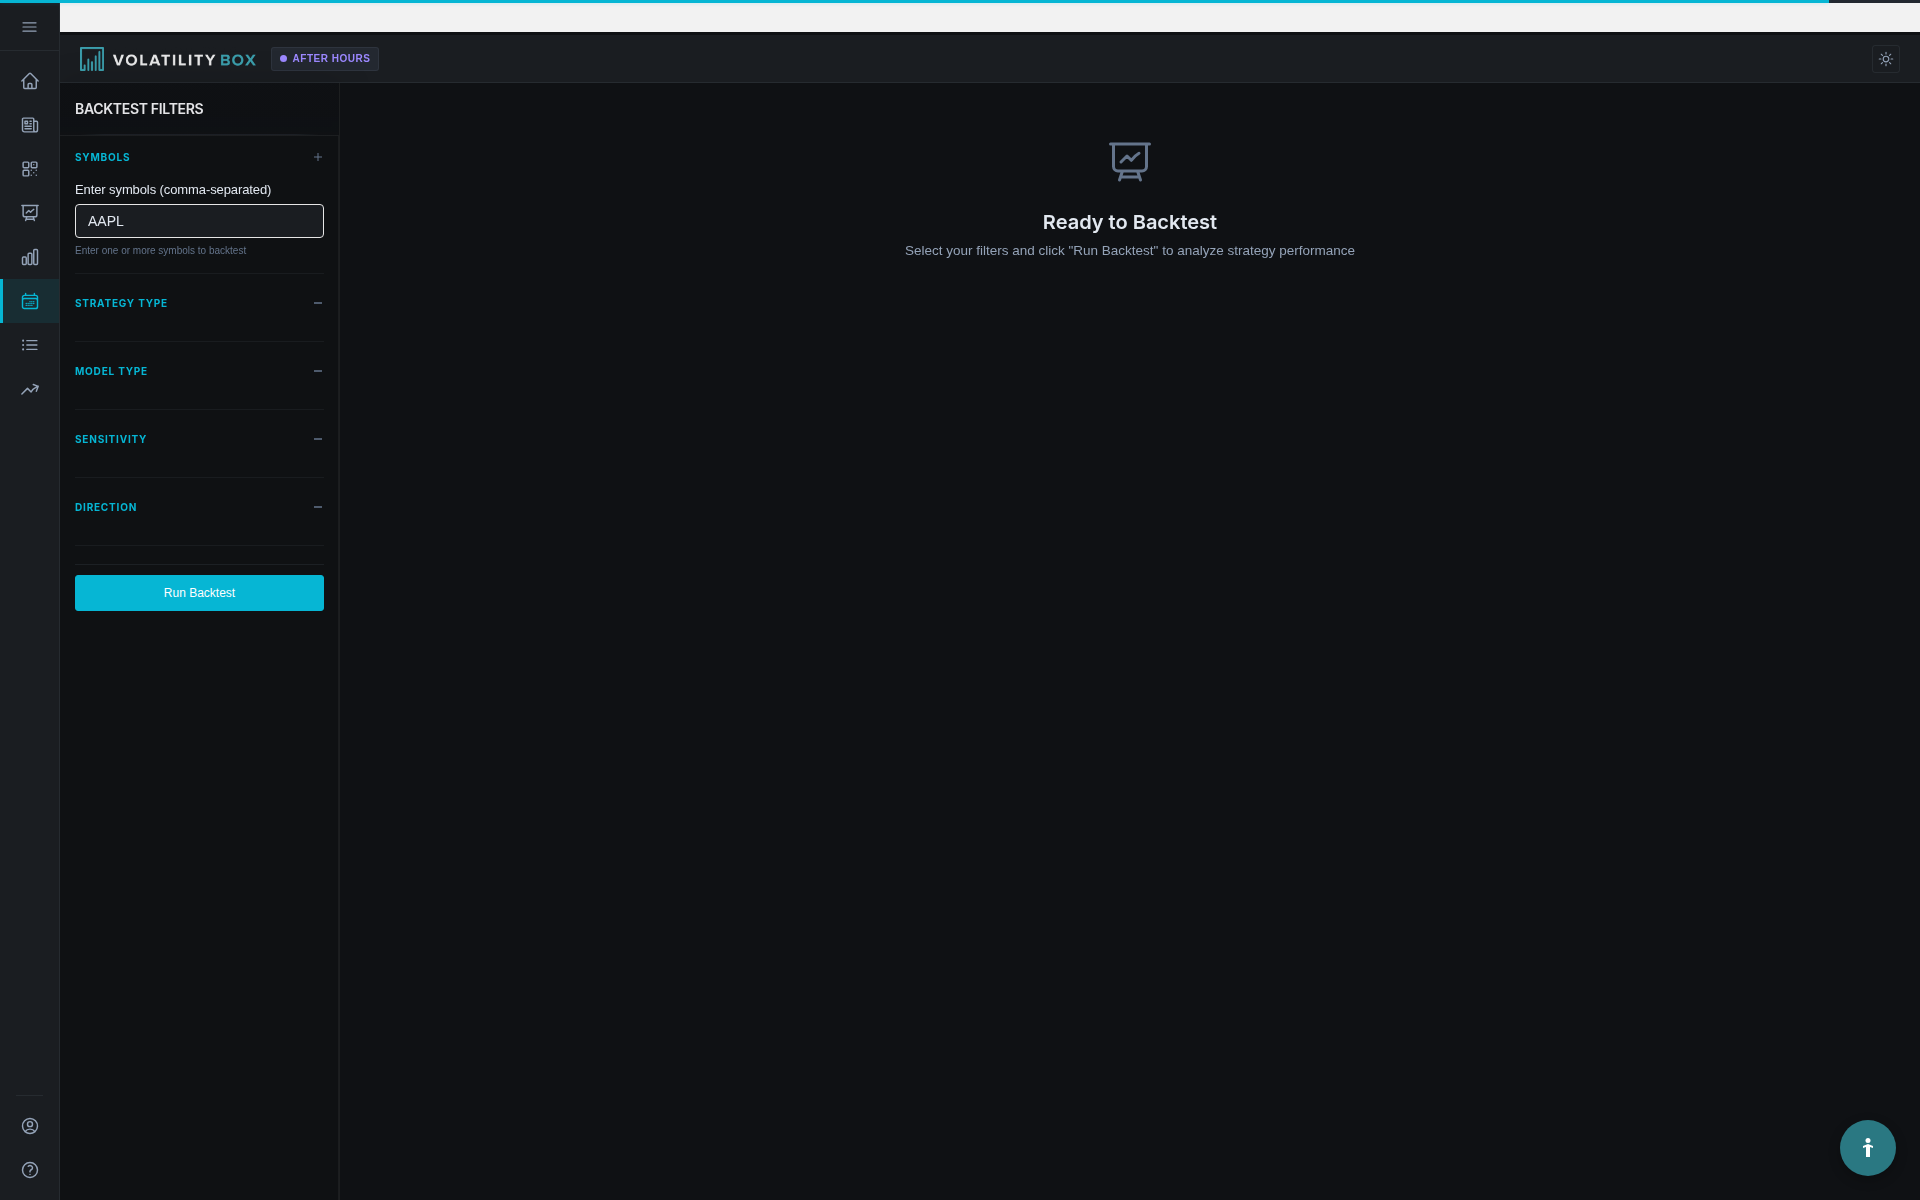
When a backtest finishes, three things fill in on the right side of the page: the headline numbers at the top, the cumulative profit and loss curve in the middle, and the trade log below it. The two headline numbers that carry the most weight are expectancy and profit factor.
Expectancy is the average result per trade. A positive expectancy means the setup made money per trade on average over the test period. That is the number to anchor on, because it accounts for both how often the setup won and how large the wins were relative to the losses.
Profit factor is the ratio of dollars won to dollars lost. A profit factor above one means more was won than lost across the sample. Below one means the reverse. Read it alongside expectancy: both positive is the combination worth trading, and the platform colors them green as a quick visual cue.
Win rate is shown too, but it is secondary. A setup can win less than half its trades and still be worth trading if its winners are large enough to produce positive expectancy. Judge a result on expectancy and profit factor first, and use win rate as context.
Reading the curve and the log
The cumulative profit and loss curve plots how the strategy accumulated over the test window. A steady climb up toward the right is what you want to see. A curve that bleeds lower is the visual version of a profit factor below one.
The trade log lists every time the setup fired over the history, with its entry, exit, and result. It is the raw record behind the headline numbers, useful when you want to see how individual trades played out rather than just the summary.
How to use it
Run these tests on the symbols you trade, and rerun them periodically. Volatility shifts over time, and a name that tested well one quarter can behave differently the next. Running the same experiments week to week also shows you how volatility on a symbol is changing, which is information in itself.
The numbers a backtest reports come from our historical model signals over the test period. They describe what happened, not what will happen. Live results also carry costs a historical study does not fully capture, such as spread and slippage on fast or thin names, so treat expectancy as a guide rather than a guaranteed outcome.
Related
Was this article helpful?
Still need help?
Can't find what you're looking for? Our support team is here to help.
Contact Support