Finding Squeeze Candidates
Short Interest Thresholds
Not all short interest creates meaningful squeeze potential, so you need to filter systematically for stocks with substantial short exposure that indicates genuinely trapped bears facing significant risk. Short interest below 10% represents normal routine short activity with essentially no squeeze potential worth pursuing for trading. 10-15% is moderate with low squeeze potential that requires a very strong catalyst to materialize into an actual squeeze. 15-20% is elevated with moderate squeeze potential where you should actively watch for reversal signals. 20-30% is heavily shorted with high squeeze potential due to significant trapped shorts who will panic if price reverses. Above 30% represents extreme short interest with very high squeeze potential that can be explosive if properly triggered, though these extreme situations are relatively rare in normal markets.
For Scanner filtering, set your minimum threshold at 20% short interest to systematically eliminate weak candidates and focus exclusively on meaningful squeeze potential. The ideal range is 25-35% short interest where you have substantial trapped shorts without getting into the rare extreme territory above 40%. Above 40% is extreme and quite rare but represents jackpot potential if a proper technical setup develops, as the sheer volume of trapped shorts can create parabolic moves when covering cascades. Start by filtering for 20%+ and methodically work your way through the results to find the best combinations of short interest, technical setup quality, and fundamental viability.
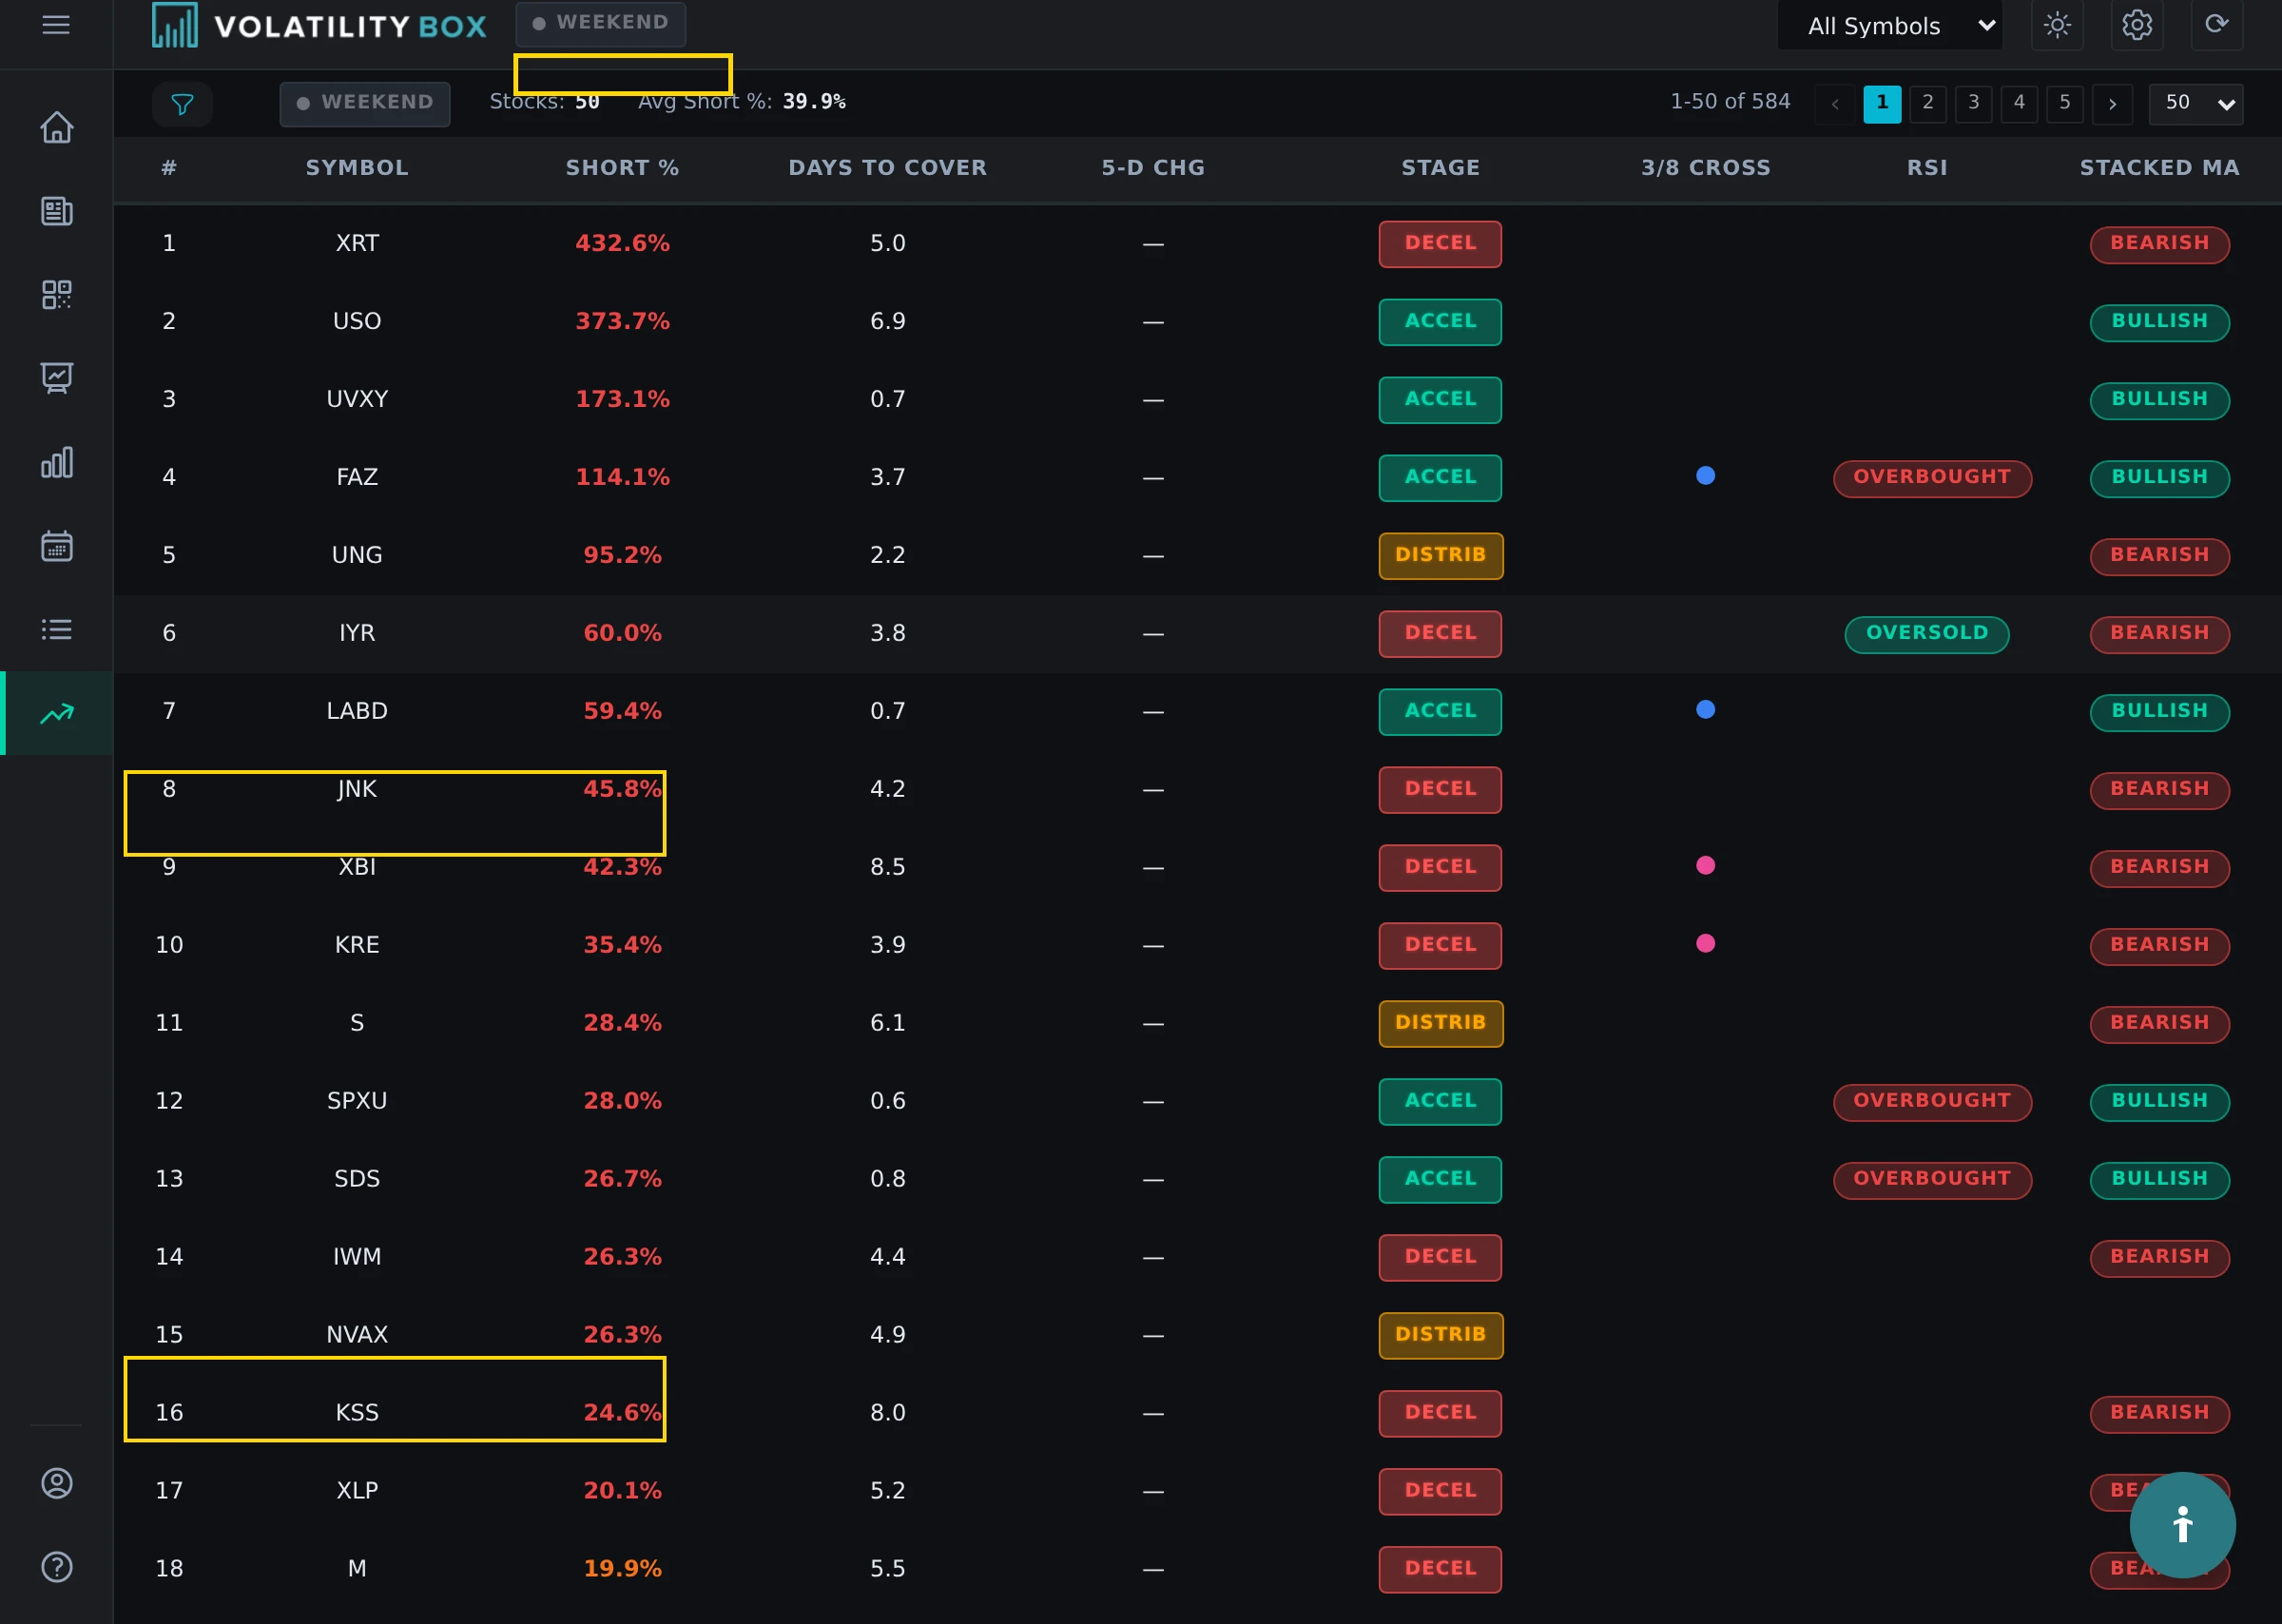
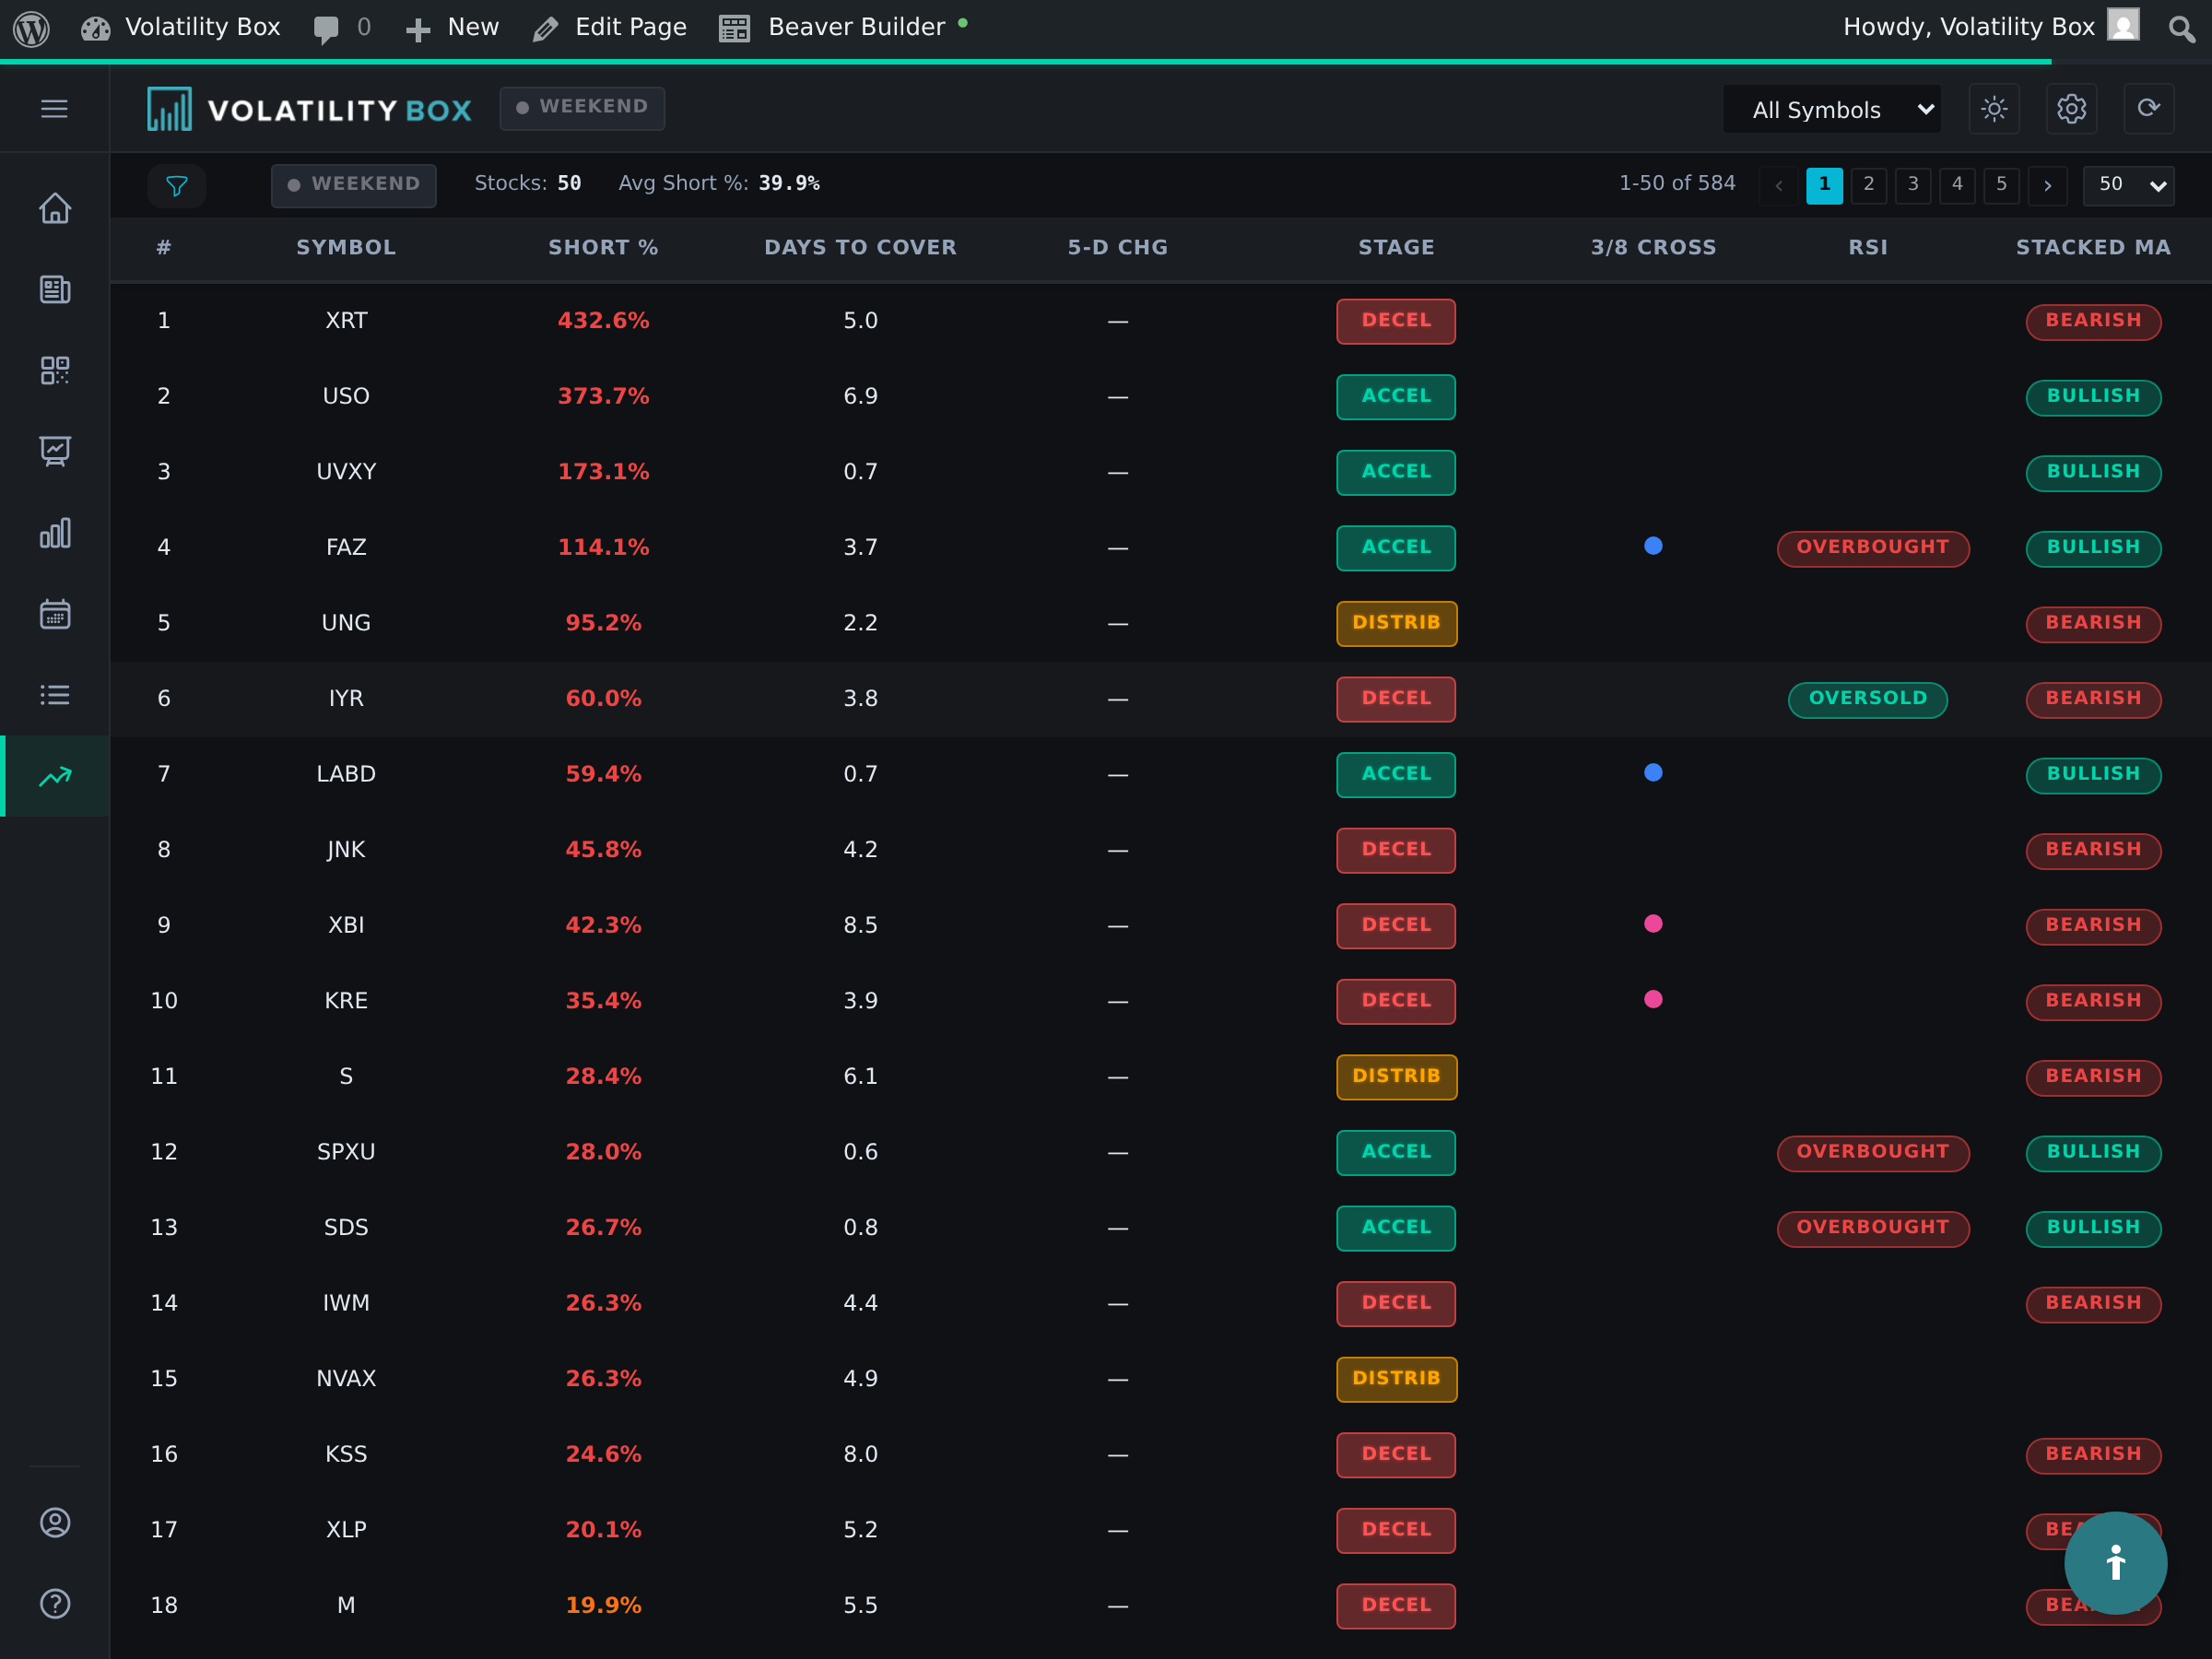
To use the Short Interest Scanner effectively, navigate to the Short Interest tab in the sidebar. The scanner displays stocks sorted by Short % by default with highest values first, making it easy to identify the most heavily shorted stocks immediately. The table shows key columns including Symbol, Short %, Float, Days to Cover, and Current Price. You can click column headers to sort by different metrics, allowing you to view stocks sorted by highest Days to Cover or smallest Float depending on your analysis needs. Review the top 20-30 results carefully and note their float and Days to Cover metrics, as these additional data points are absolutely required for identifying true squeeze potential beyond just the short percentage.
Days to Cover Requirements
High short percentage alone is not sufficient for high-probability squeeze trades because you also need shorts to be genuinely trapped, unable to cover their positions quickly without driving prices significantly higher. Days to Cover (DTC) measures this trap intensity by showing how long it would theoretically take shorts to exit at average daily volume. DTC below 3 days means shorts can cover easily with minimal price impact (skip these entirely), 3-5 days represents moderate squeeze pressure worth monitoring, 5-8 days represents high squeeze pressure (ideal territory for squeeze trades), and above 8 days represents extreme squeeze risk with the best possible setups since shorts are truly trapped with no easy exit.
Understanding why DTC matters requires grasping the mechanics of forced covering and market liquidity constraints. If short interest is 20 million shares and daily volume is 10 million, shorts can cover in just 2 days (2 DTC) so they are not truly trapped. They can exit relatively easily if price moves against them without causing major disruption. Contrast this with short interest of 20 million shares and daily volume of only 2 million, creating 10 Days to Cover where it would take 10 full trading days for all shorts to exit. These shorts are genuinely trapped because there is literally not enough liquidity for them to exit without driving prices dramatically higher, and if price starts rising they panic knowing there is no quick escape, creating the explosive covering dynamics that define true squeezes.
The Short Interest Scanner displays Days to Cover in a dedicated column, allowing you to quickly identify trapped shorts. Click the DTC column header to sort stocks by Days to Cover with highest values at the top. Look for combinations of high short % (above 20%) with high DTC (above 5) to identify the most squeezable names. You can visually scan the table or use filters to narrow down to stocks meeting both criteria simultaneously, creating your working list of prime squeeze candidates before even looking at charts or technical setups.
Technical Setup Requirements
High short interest is emphatically not a buy signal on its own. You must wait for technical reversal confirmation or you are just gambling on hope rather than trading with edge. Before entering any squeeze trade, verify these five technical requirements are all met simultaneously: a VB LONG signal is present (price breach of VB lower band creating reversal setup), a support level is nearby (Darvas box low, 50-day EMA, or prior swing low providing a floor), a bullish reversal candle has formed (hammer, bullish engulfing, or morning star pattern), RSI shows oversold bounce (RSI below 35 and now turning upward), and volume has surged (1.5x or greater than average daily volume on the reversal day). All five boxes must be checked before entering the trade.
Consider a BYND setup example with short interest at 31.8% and DTC of 6.4 days (excellent squeeze metrics that pass the quantitative filters). The technical analysis shows price dropped from $22 to $8.50 over several months as shorts piled in aggressively. The VB Signal triggers LONG at $8.50 using Daily Conservative with conviction of 84, indicating high-quality reversal with strong statistical backing. Support exists at $8.50 from a prior swing low 6 months ago that held previously, providing a logical floor. The candle pattern shows a hammer on the $8.50 breach day with long lower wick rejecting lower prices. RSI reads 28 (extreme oversold) and is turning upward showing momentum shift. Volume is 18M shares, representing 2.8x average daily volume indicating strong buying interest. All five boxes are checked, making this a legitimate squeeze candidate worth considering for entry with real capital.
Red flags to avoid include several warning signs that indicate low probability of success: no VB signal despite high short interest (just hoping for a squeeze without technical confirmation), no support level with price in free-fall (catching a falling knife), bearish candle on the high short interest day indicating continuation not reversal, and volume declining rather than surging (no buying interest despite short exposure). Any of these red flags should make you immediately pass on the trade regardless of how appealing the short interest metrics appear, because without technical confirmation you are speculating rather than trading with edge. Discipline means waiting for the right setup, not forcing trades because you are bored or fear missing out.
Volume Surge Detection
Volume confirms that buyers are actually stepping in to fight the shorts rather than just a temporary blip in an ongoing downtrend. To check volume on any potential squeeze candidate, open the main Volatility Scanner and locate the symbol to view its current activity, or use your trading platform charts to compare today’s volume to the 50-day moving average. This visual comparison quickly reveals whether volume is normal, elevated, or surging dramatically.
Volume thresholds indicate different levels of buying interest and squeeze probability that guide your entry decision. Volume below 1x average means no interest (skip the setup entirely). 1-1.5x average represents mild interest (wait for more confirmation before entering). 1.5-2x average represents strong interest and a potential squeeze starting to develop. Above 2x average represents extreme interest where a squeeze is likely already underway and you should act quickly if other criteria are met. The key is that volume surge must accompany the technical reversal. A reversal on light volume is suspect and often fails quickly, while a reversal on heavy volume indicates real buying pressure overwhelming the shorts and driving genuine price discovery.
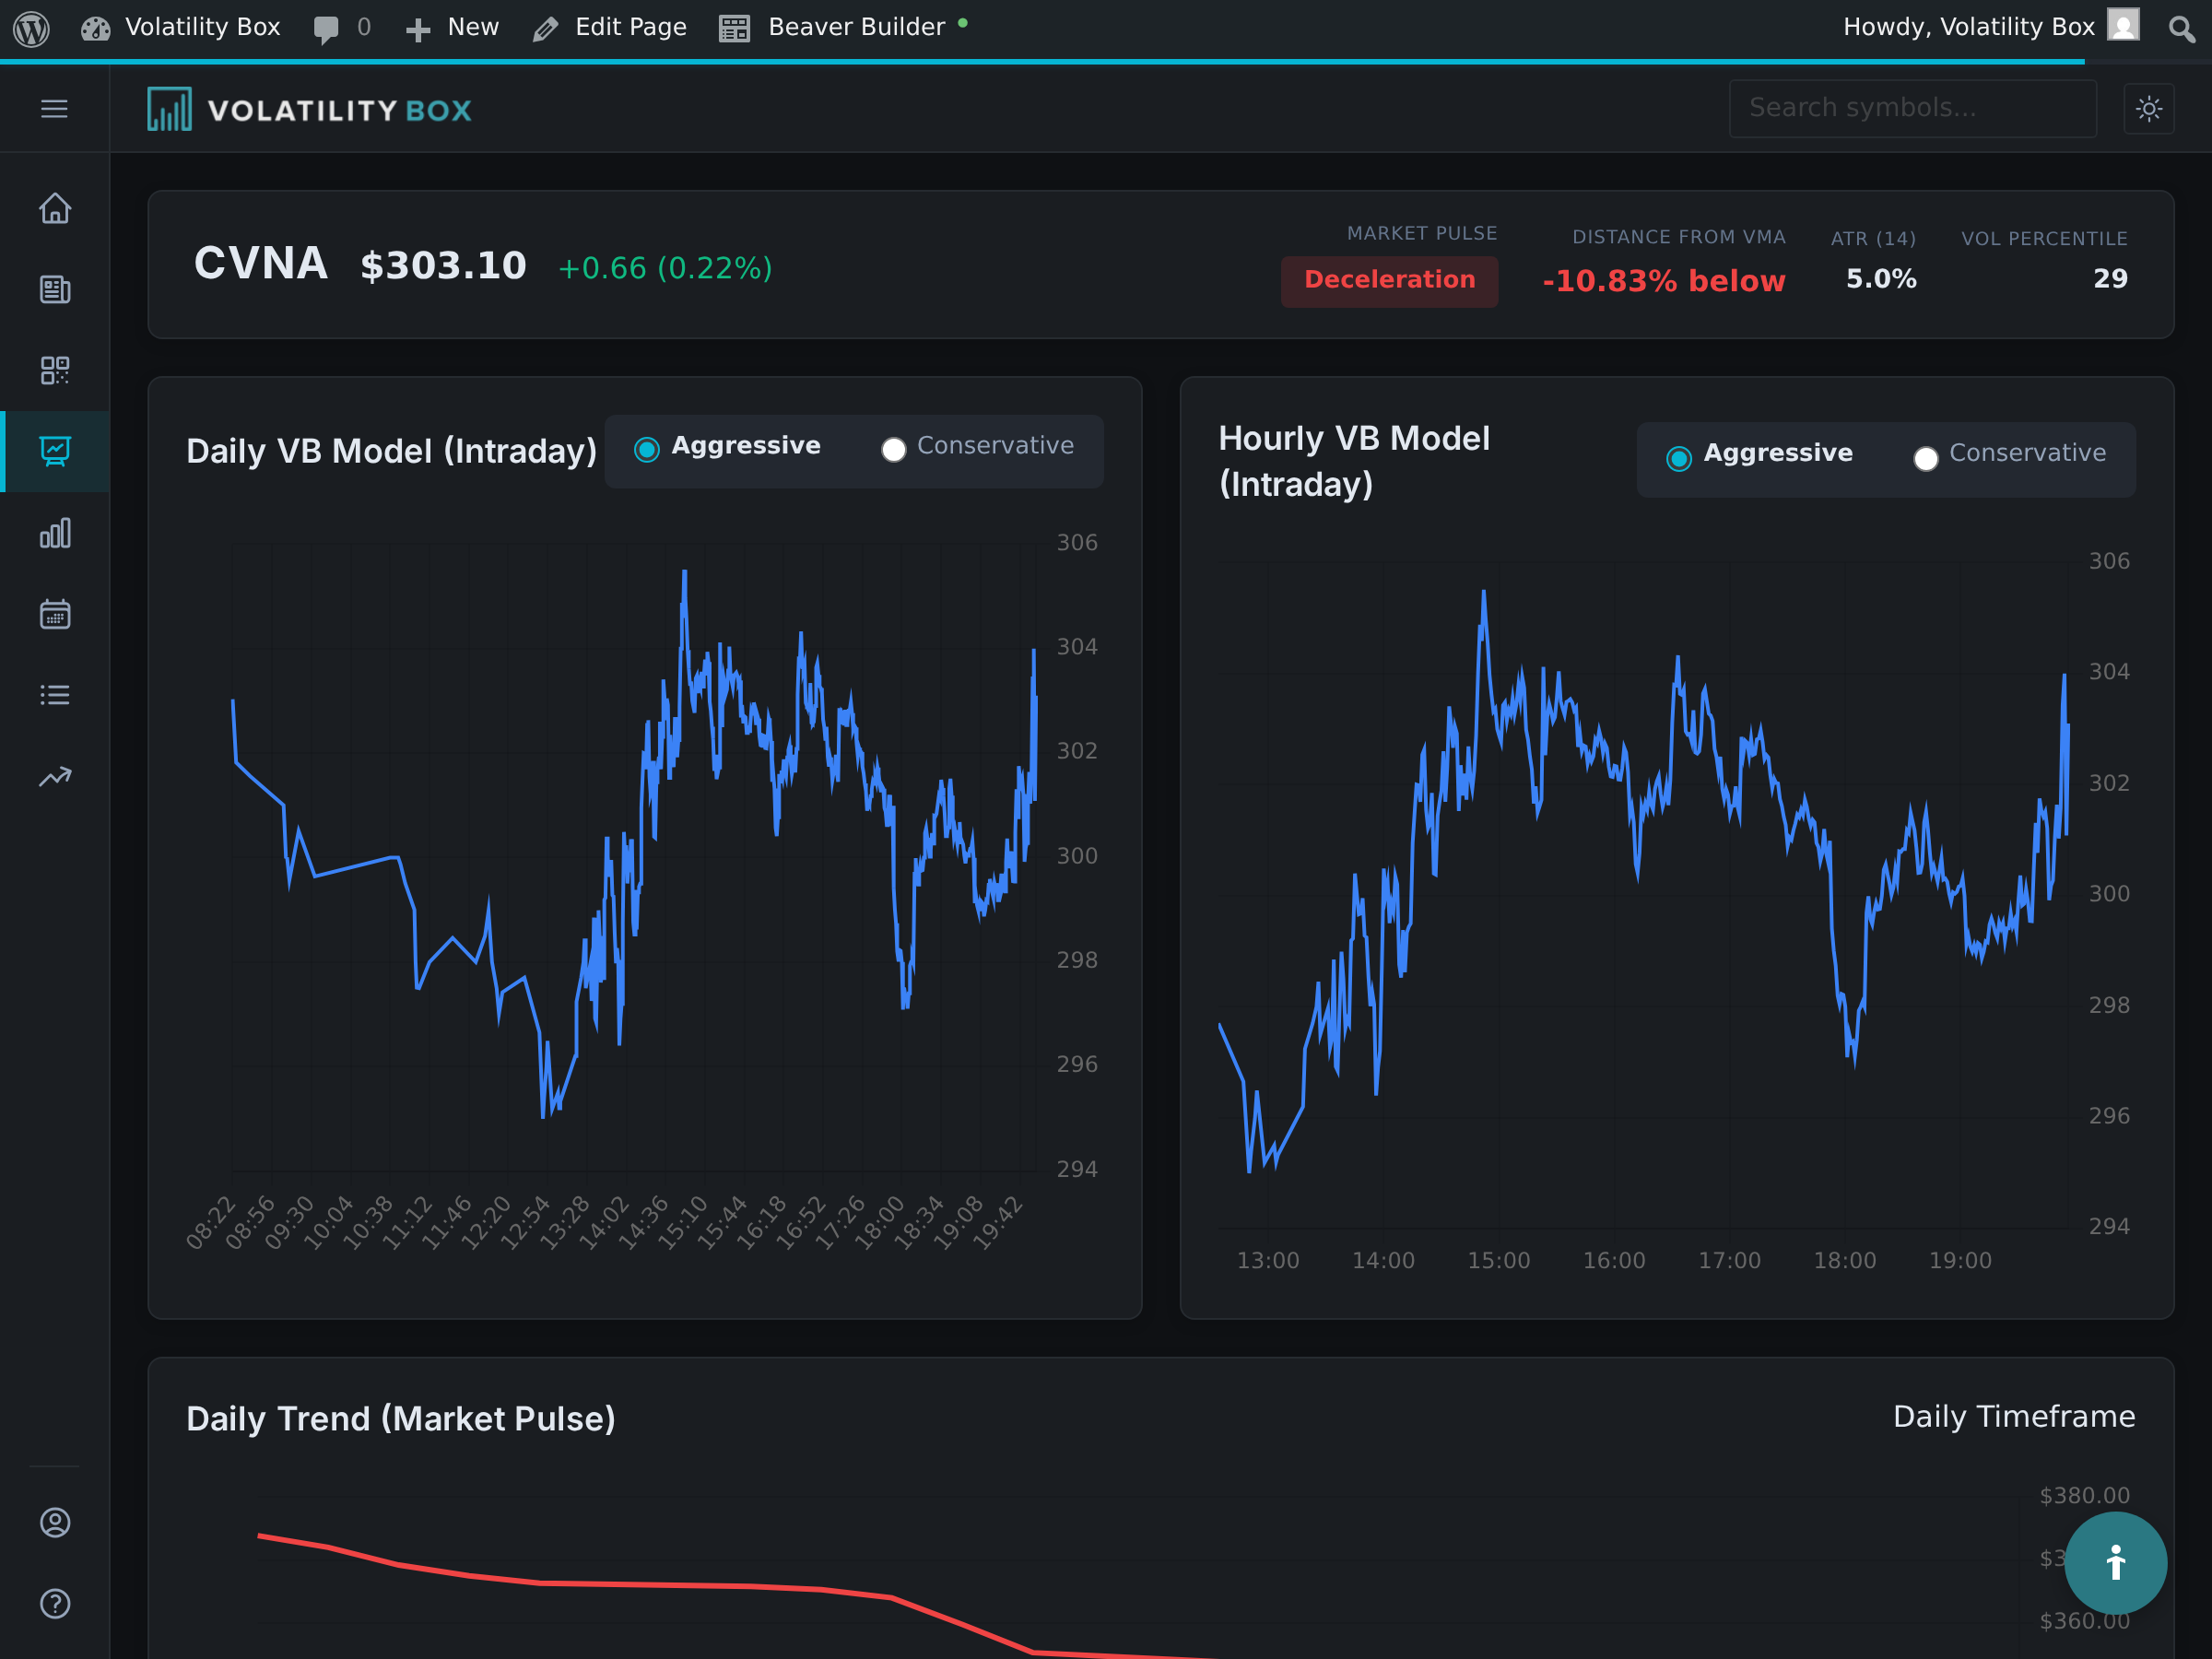
For example, analyzing CVNA might show Average Daily Volume of 8.2 million shares based on recent trading history, but on a given day volume explodes to 22.4 million shares (2.7x average) and price jumps 12% on that day. The interpretation is crystal clear: heavy buying pressure is entering the stock, likely triggering panic short covering and signaling that a squeeze is beginning to develop. Enter on the volume surge day if the setup is complete with all five technical boxes checked, or the next day if the setup remains intact with price holding above the Volatility Box entry level. Volume is often the final confirmation that separates real squeezes from false starts that fizzle quickly.
Catalyst Identification
Squeezes do not happen randomly without reason. There is usually a specific catalyst that shifts sentiment and triggers the reversal that traps overconfident shorts. Common squeeze catalysts include earnings beats (company reports better-than-expected results, invalidating bearish thesis), guidance raises (management increases forward projections, suggesting business is stronger than shorts believed), new product launches (positive reception and strong pre-orders prove shorts wrong about demand), partnerships or deals (strategic partnership or acquisition interest validates the business model), analyst upgrades (major bank raises rating or price target, bringing institutional attention), short seller reports debunked (company disproves negative claims with evidence), and sector rotation (money flows into a heavily-shorted sector, lifting all boats). Identifying the specific catalyst helps you assess whether the reversal is likely to be sustained or just a temporary spike.
Before entering any squeeze trade, research recent catalysts systematically by checking recent news from the last 3 days (Google “[SYMBOL] news”), upcoming earnings dates (check your broker platform or financial websites), recent analyst activity (Yahoo Finance then Analysis tab), and social media buzz (high Reddit/Twitter activity can be a catalyst though it is risky and unpredictable). Understanding the catalyst helps you assess whether the reversal is likely to be sustained by fundamental improvement or just a temporary spike that will fail. Strong catalysts include fundamental business improvements like earnings beats or partnerships, while weak catalysts include pure social media hype without underlying business improvement.
Consider a hypothetical BYND catalyst scenario: BYND announces a major partnership with a large fast-food chain to roll out plant-based menu items nationwide, a deal that could dramatically increase revenue and market penetration. The stock gaps 15% higher on the news as the market reprices BYND’s growth prospects dramatically upward. Shorts who bet on bankruptcy or declining sales are now trapped as the thesis is fundamentally invalidated by this partnership, forcing them to cover at losses or risk even larger losses if the rally continues. This is a textbook catalyst that combines perfectly with technical setup and short interest to create a high-probability squeeze trade with strong fundamental backing.
Cross-Referencing with Volatility Scanner
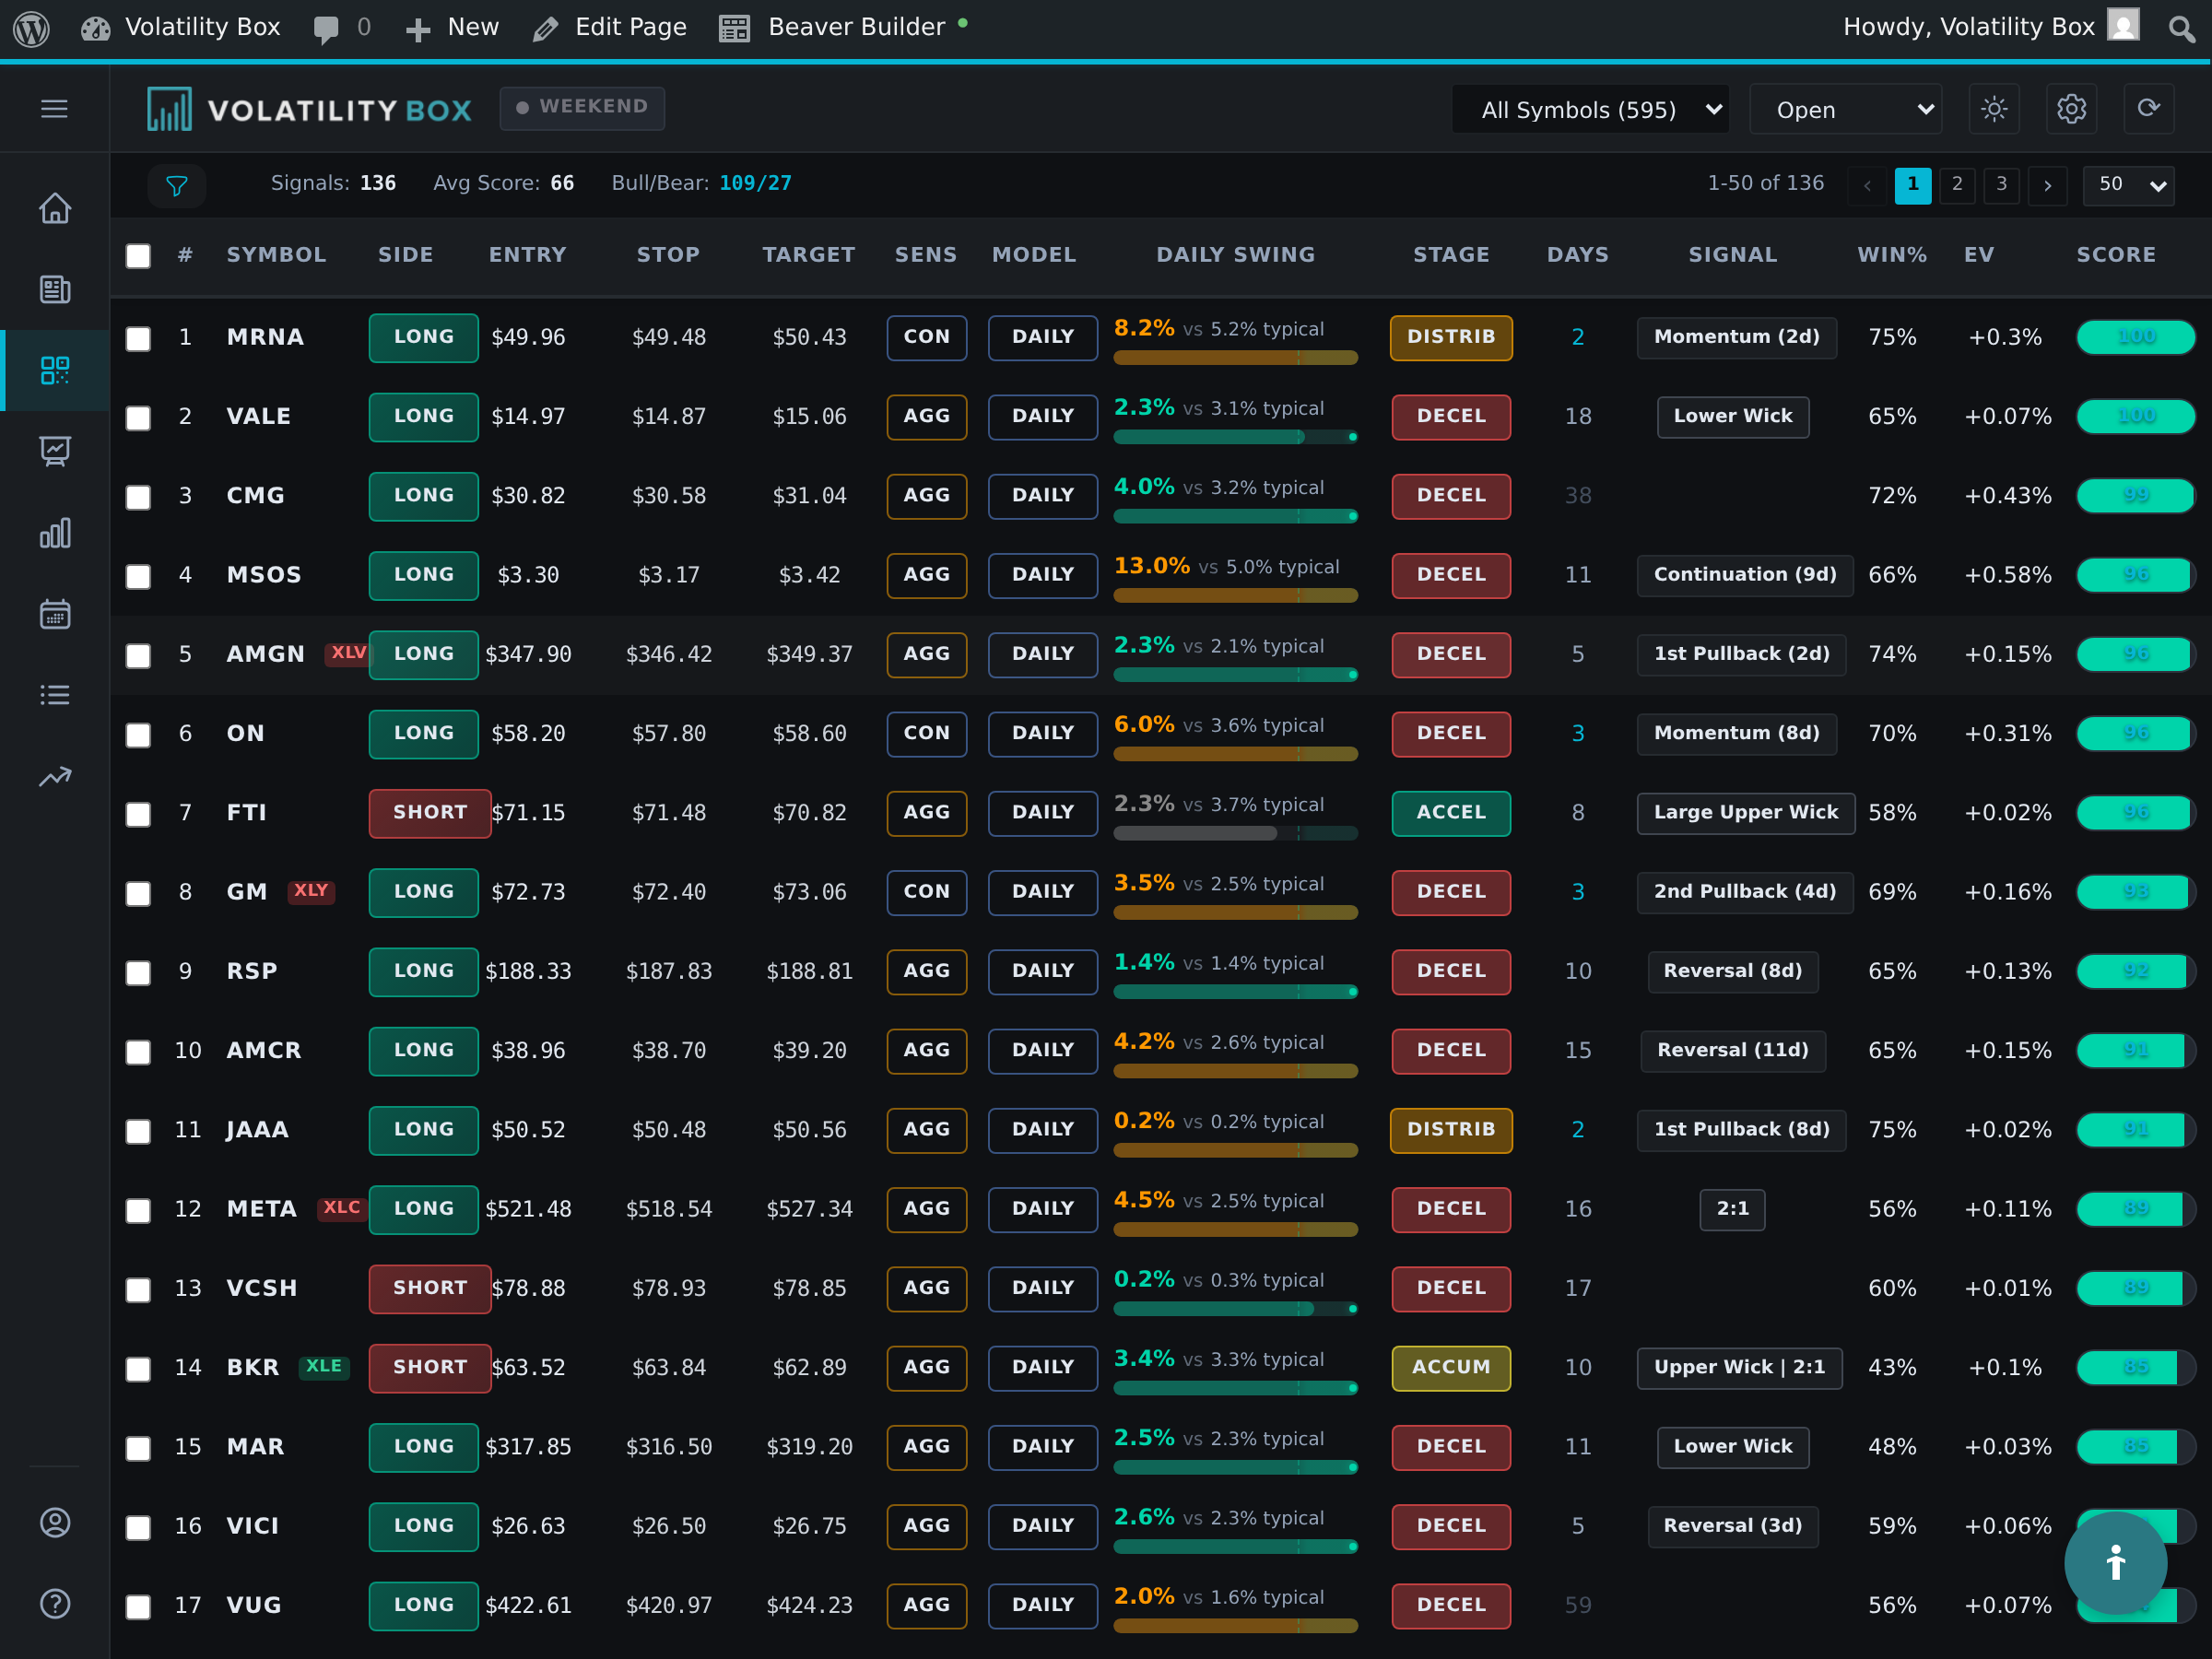
The magic happens when both the Short Interest Scanner and the main Volatility Scanner align on the same symbol, creating powerful confluence that dramatically improves win rate. The two-scanner workflow starts by using the Short Interest Scanner to identify 10-15 potential squeeze candidates with Short % greater than 20% and DTC greater than 5. Then check the main Volatility Scanner for those specific symbols to see if any currently have LONG signals, preferably with conviction 80+ and Market Pulse showing WITH trend or TR (Trend Reversal) signal. The confluence occurs when a symbol appears on both scanners with strong setups, making this a high-probability squeeze trade worth taking with real capital.
Walk through an example workflow. Step 1: Short Interest Scanner shows CVNA (34.2% short, 8.2 DTC), BYND (31.8% short, 6.4 DTC), and W (26.9% short, 7.8 DTC) as top candidates meeting quantitative filters. Step 2: Check the main Volatility Scanner for these three specific symbols, finding CVNA with LONG signal at $18.40 entry, conviction 82, Market Pulse Yellow TR signal (Trend Reversal indicating major turn); BYND with LONG signal at $8.50 entry, conviction 84, but Market Pulse Red showing AGAINST trend (fighting the trend); and W with no VB signal today (no technical confirmation yet). Step 3: Decision time. CVNA is an immediate trade since both scanners align perfectly with TR signal and high conviction. BYND is watch-only since the VB signal exists but AGAINST trend makes it significantly riskier. W is a skip since there is no VB signal despite good short interest metrics. This systematic cross-referencing eliminates most losing trades by requiring confluence before entry, dramatically improving your win rate.
Historical Squeeze Examples
Learning from past squeezes helps you recognize the patterns and warning signs in real-time before they are obvious in hindsight. GME in January 2021 remains the most famous example in recent history, with setup showing 140% short interest (more shares short than existed in the float, indicating massive over-shorting) and 6+ Days to Cover. The catalyst was Ryan Cohen joining the board bringing e-commerce expertise and Reddit WallStreetBets momentum creating buying pressure. Price action went from $20 to $483 in just 15 days as shorts were completely trapped and forced to cover at any price. The outcome was a massive squeeze that destroyed several hedge funds and generated billions in losses for shorts while rewarding early longs with life-changing gains.
TSLA in 2020 provides a different squeeze example with a more sustained trajectory over months rather than weeks. The setup showed 18% short interest and 5.2 Days to Cover (high but not extreme). The catalyst was Q3 2019 surprise profit proving the company could be profitable, followed by inclusion in the S&P 500 which required index funds to buy billions of dollars of shares. Price action went from $350 to $900 over 4 months (pre-split prices), representing a sustained squeeze as fundamentals improved and shorts gradually capitulated. The outcome was a sustained squeeze where improving fundamentals supported the higher prices, unlike meme squeezes that collapse quickly once the buying pressure exhausts.
AMC in June 2021 demonstrated gamma squeeze mechanics layered on top of short interest. The setup showed 20% short interest and 4.8 Days to Cover (moderate). The catalyst was reopening optimism post-COVID combined with retail buying surge and massive call option activity. Price action went from $12 to $72 in just 10 days as both shorts covered and options market makers hedged by buying shares. The outcome combined short squeeze dynamics with gamma squeeze (options-driven buying), creating explosive but short-lived gains that collapsed quickly once the options expired. These historical examples show the range of squeeze outcomes from sustained (TSLA) to explosive but brief (GME, AMC).
Lessons from these historical squeezes include several critical insights for trading them successfully. Early entry is key (GME at $20-40 made fortunes, but buying at $300 meant you got crushed on the collapse). Exit discipline matters enormously (GME fell from $483 to $40 in just 5 days, destroying latecomers who held hoping for $1000). Fundamentals matter for sustainability (TSLA sustained because business improved and justified higher prices, while GME and AMC collapsed because fundamentals did not support the elevated valuations). These lessons should inform your squeeze trading approach, emphasizing early entry on technical confirmation, quick profit-taking at targets, and skepticism about sustained rallies unless fundamentals genuinely support them.
Building a Squeeze Watchlist
Monitor high-short-interest stocks continuously so you catch setups as they develop rather than after they have already moved significantly. To create your squeeze watchlist, go to the Short Interest Scanner and identify the top 20 symbols with the highest combination of Short % and Days to Cover. Note these symbols in a dedicated watchlist within your trading platform or in a simple spreadsheet. This dedicated list keeps squeeze opportunities front and center without cluttering your main trading watchlists with speculative names.
Implement a weekly review process every Sunday to keep the watchlist current and relevant to evolving market conditions. Check the Short Interest Scanner for new high-short names that have entered the zone since last week, and add them to your watchlist. Remove symbols with short interest dropping below 15% since they no longer have meaningful squeeze potential. Check the main Volatility Scanner for LONG signals on any watchlist symbols to identify active setups requiring immediate attention. Finally, set price alerts on your broker platform for your top 5 squeeze candidates so you are notified when significant price movement occurs during the week. This systematic weekly review ensures you never miss a high-probability squeeze setup while keeping your watchlist lean and focused on current opportunities.
Squeeze Candidate Checklist
Before entering any squeeze trade, verify these ten criteria to ensure you have a high-probability setup rather than a speculative gamble. The checklist includes: Short % greater than 20% (preferably greater than 25% for stronger squeeze potential), Days to Cover greater than 5 (preferably greater than 7 for trapped shorts), VB LONG signal present with conviction 80+ (confirming technical reversal), technical reversal pattern visible (hammer, engulfing, morning star candle), support level nearby (Darvas box, prior swing low providing a floor), volume surge greater than 1.5x average (confirming buying interest), RSI oversold below 35 and turning upward (indicating exhaustion reversal), catalyst identified (news, earnings, or event explaining the reversal), fundamentals not catastrophic (company is viable, not heading for bankruptcy), and position sized at 50% of normal (risking 1% not 2% due to elevated squeeze volatility).
Score your setup objectively by counting how many boxes you can check: if 8 or more out of 10 boxes are checked, seriously consider the trade with full position size; if 6-7 boxes checked, it is a marginal setup worth taking at reduced size or with tighter stops; if fewer than 6 boxes checked, skip it because there is insufficient confluence for high-probability success. This systematic checklist removes emotion and gut feel from the decision, replacing it with objective criteria that have proven predictive of squeeze success in backtesting and live trading. Keep this checklist visible during your weekend analysis and before any squeeze entry to maintain discipline and prevent impulsive trades based on FOMO or recent results.
Next Steps
Find your first squeeze candidate by navigating to the Short Interest tab in the Volatility Box platform sidebar. Sort the table by Short % to identify stocks with the highest short interest, then check the DTC column for those with Days to Cover above 5. Identify the top 3 symbols that meet both criteria and write them down. Cross-reference these 3 symbols with the main Volatility Scanner to see if any currently have LONG signals with conviction above 75. For any that show up on both scanners, review the charts to assess technical setup quality and check volume characteristics. Research catalysts by Googling news for each symbol over the past week to understand what might trigger or sustain a reversal. If one candidate checks all or most boxes on the squeeze checklist, paper trade it first to build pattern recognition and confidence before risking real capital. Do not risk real money on squeeze trades until you have successfully paper traded 5-10 setups and understand their unique dynamics, as these trades carry elevated risk and require experience to execute well.
Was this article helpful?
Still need help?
Can't find what you're looking for? Our support team is here to help.
Contact Support