Every level for a symbol, on one chart.
Click any name and its volatility levels appear pre-plotted, daily and hourly together, with the current trend read alongside. You confirm a setup at a glance instead of charting it by hand.
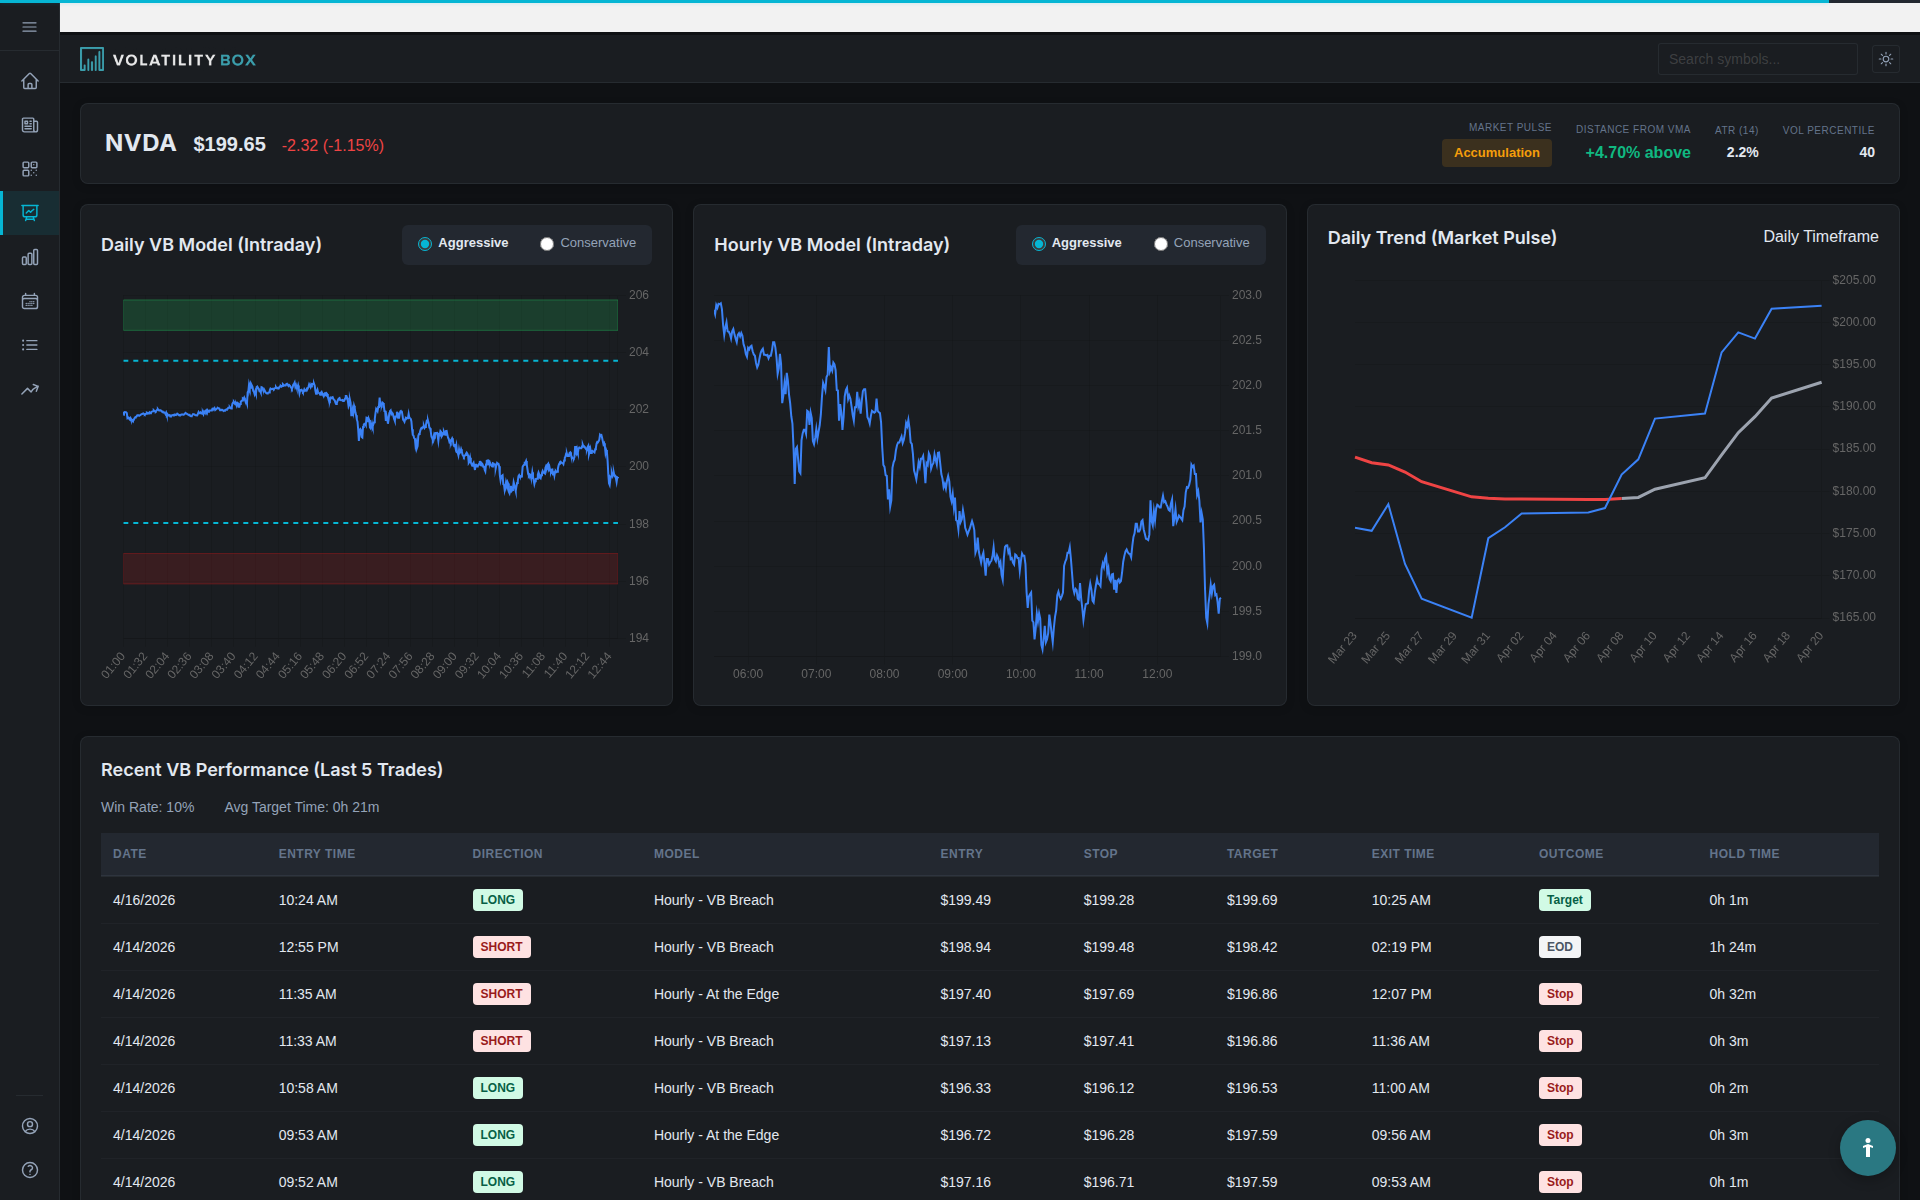
Everything you need, in one view.
Each symbol page brings the levels, the trend, and the recent history together, so you can validate a setup without switching tools or drawing a single line yourself.
Levels on the chart
Entry, stop, and target are already plotted against current price. You see where the setup sits the moment you open the page.
Trend context
The current trend read sits right beside the levels, so you know whether the broader move favors the trade before you take it.
Recent history
The last setups on this name and how they played out, so a new signal arrives with evidence behind it.
Daily and hourly
Both timeframes on the same page. The daily shows the larger picture, the hourly shows the precise levels for the entry.
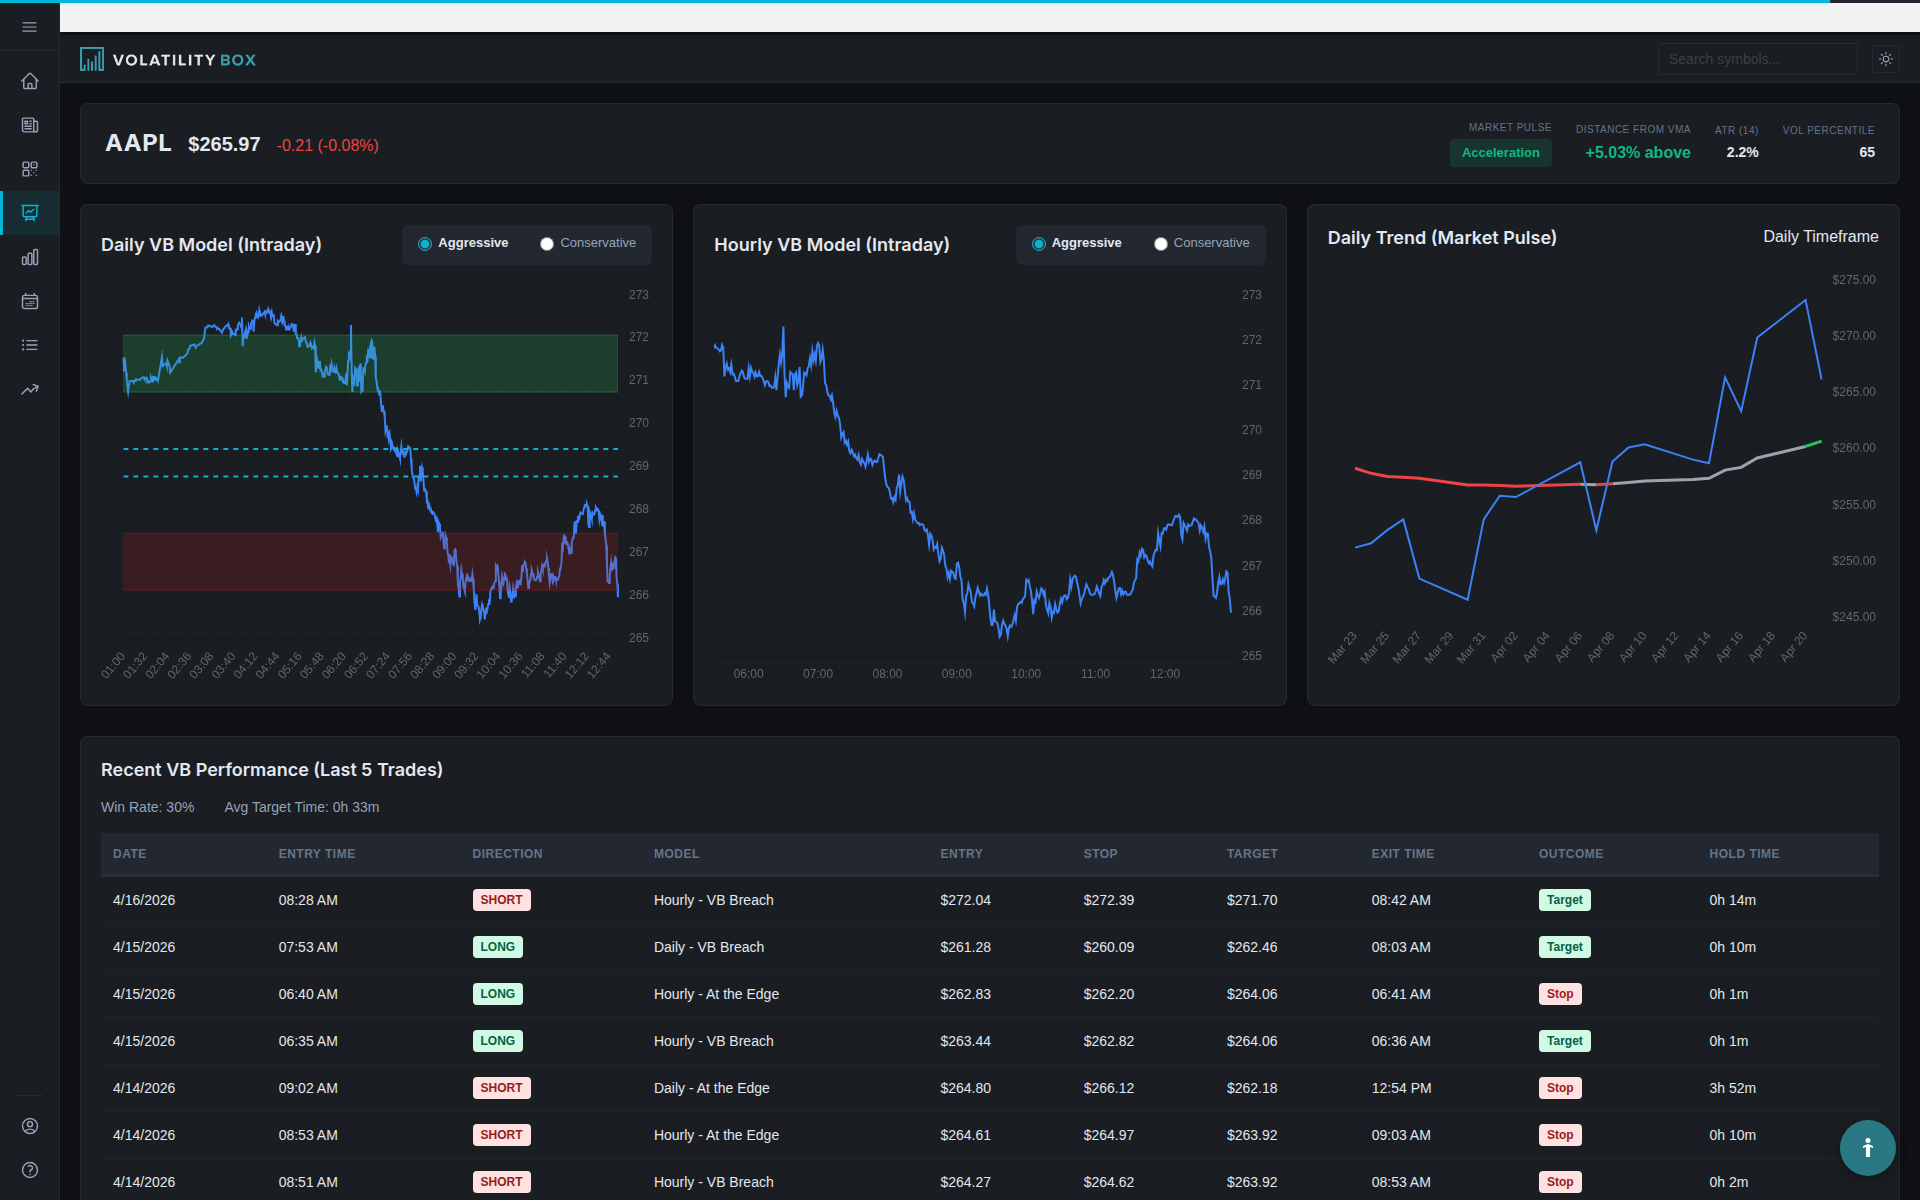
Daily and hourly, read together.
Both timeframes are visible at once. The daily chart tells you whether the name is sitting at a broader extreme. The hourly chart gives you the precise levels for a tactical entry. You see the whole picture without flipping between screens.
When both timeframes line up on the same side, you have confluence you can act on. When they disagree, the chart makes the case for waiting.
Validate before you act.
A signal is a starting point, not a decision. With the levels, the trend, and the recent history in one view, the read becomes a check you can make in moments.
No manual charting
The levels are already drawn. You skip the setup work and go straight to the read, every time you open a name.
Confirm at a glance
Price, levels, and trend in one frame. You confirm the setup is real before you commit, not after.
Pass with conviction
When the chart does not support the trade, you see it clearly. That makes it easy to leave a name alone today.
What traders say.
See the setup before you trade.
Levels, trend, and recent history on every symbol. Open a name and confirm in a glance.