See your edge, and exactly where to enter.
Volatility Box reads the liquid markets where institutions trade and shows you which ones matter today, the direction to take them, and the level to act on.
Most markets are not worth trading. Knowing the few that are is the edge.
On any given day, only a handful of markets offer an edge. Volatility Box reads the liquid markets institutions trade, finds those few, and shows you the direction and the level to act on.
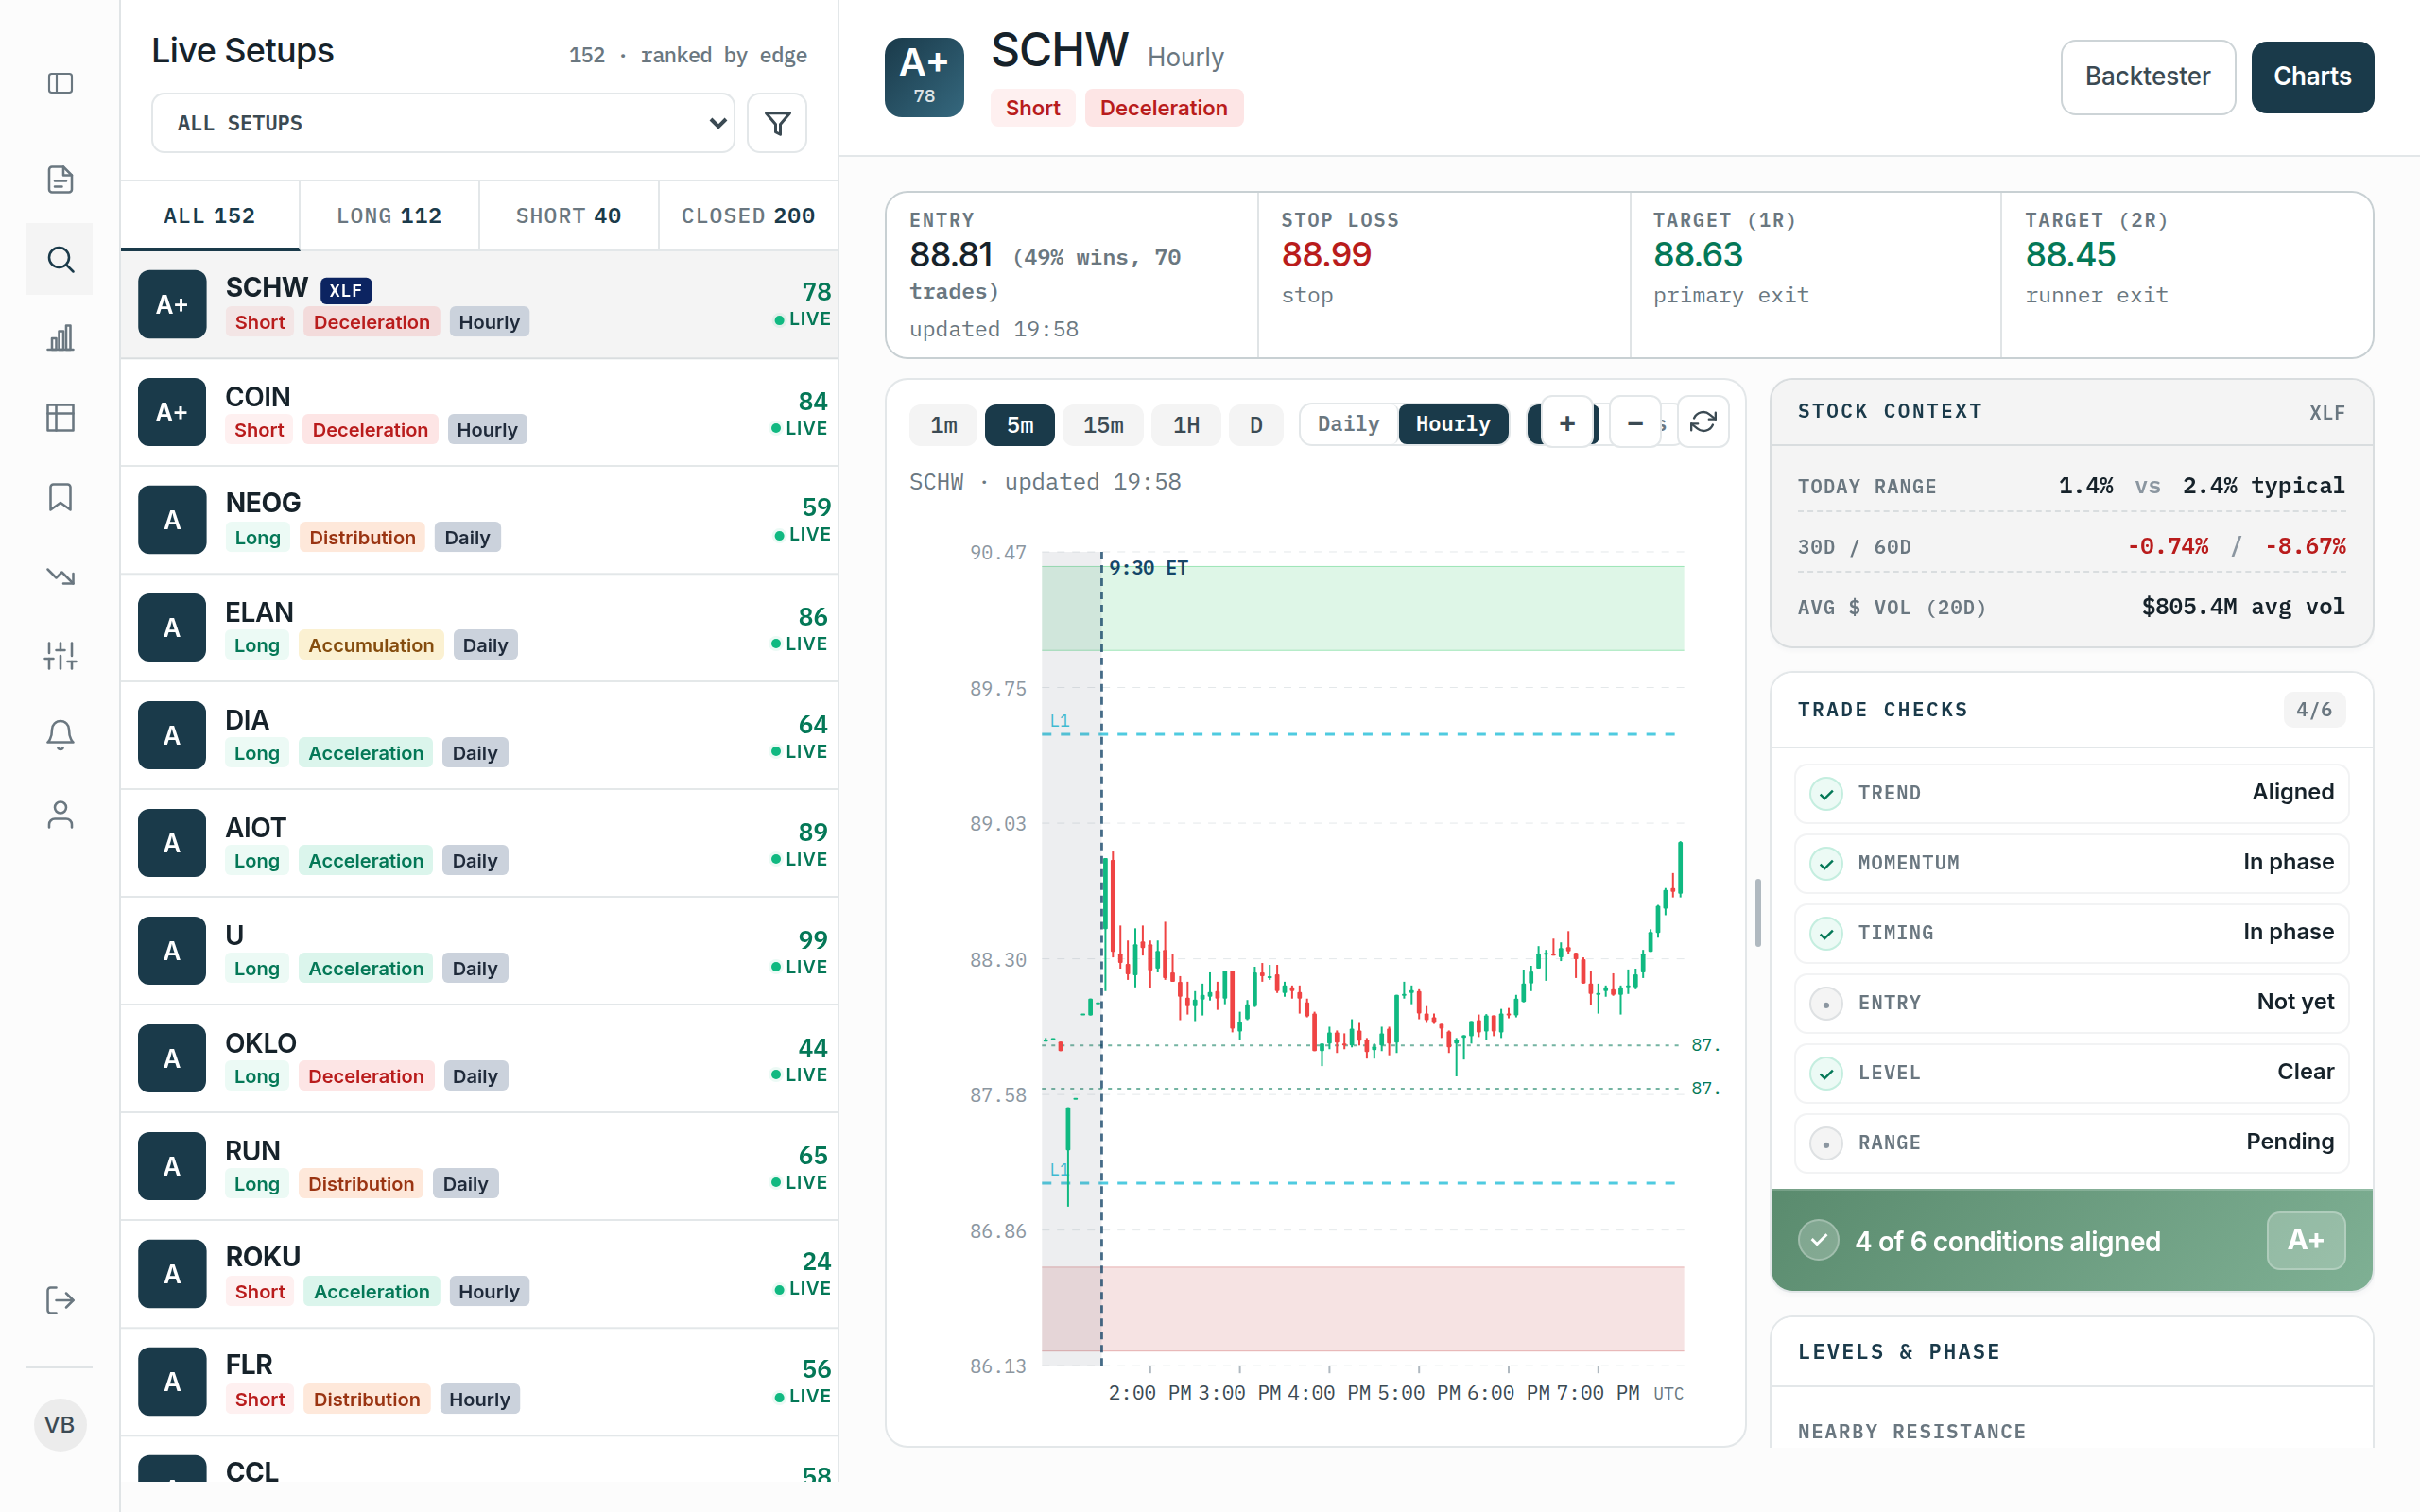
Read the conditions before you commit.
You see whether the volatility backdrop is in your favor before you put money to work, so you can lean in when it counts and stand aside when it does not.
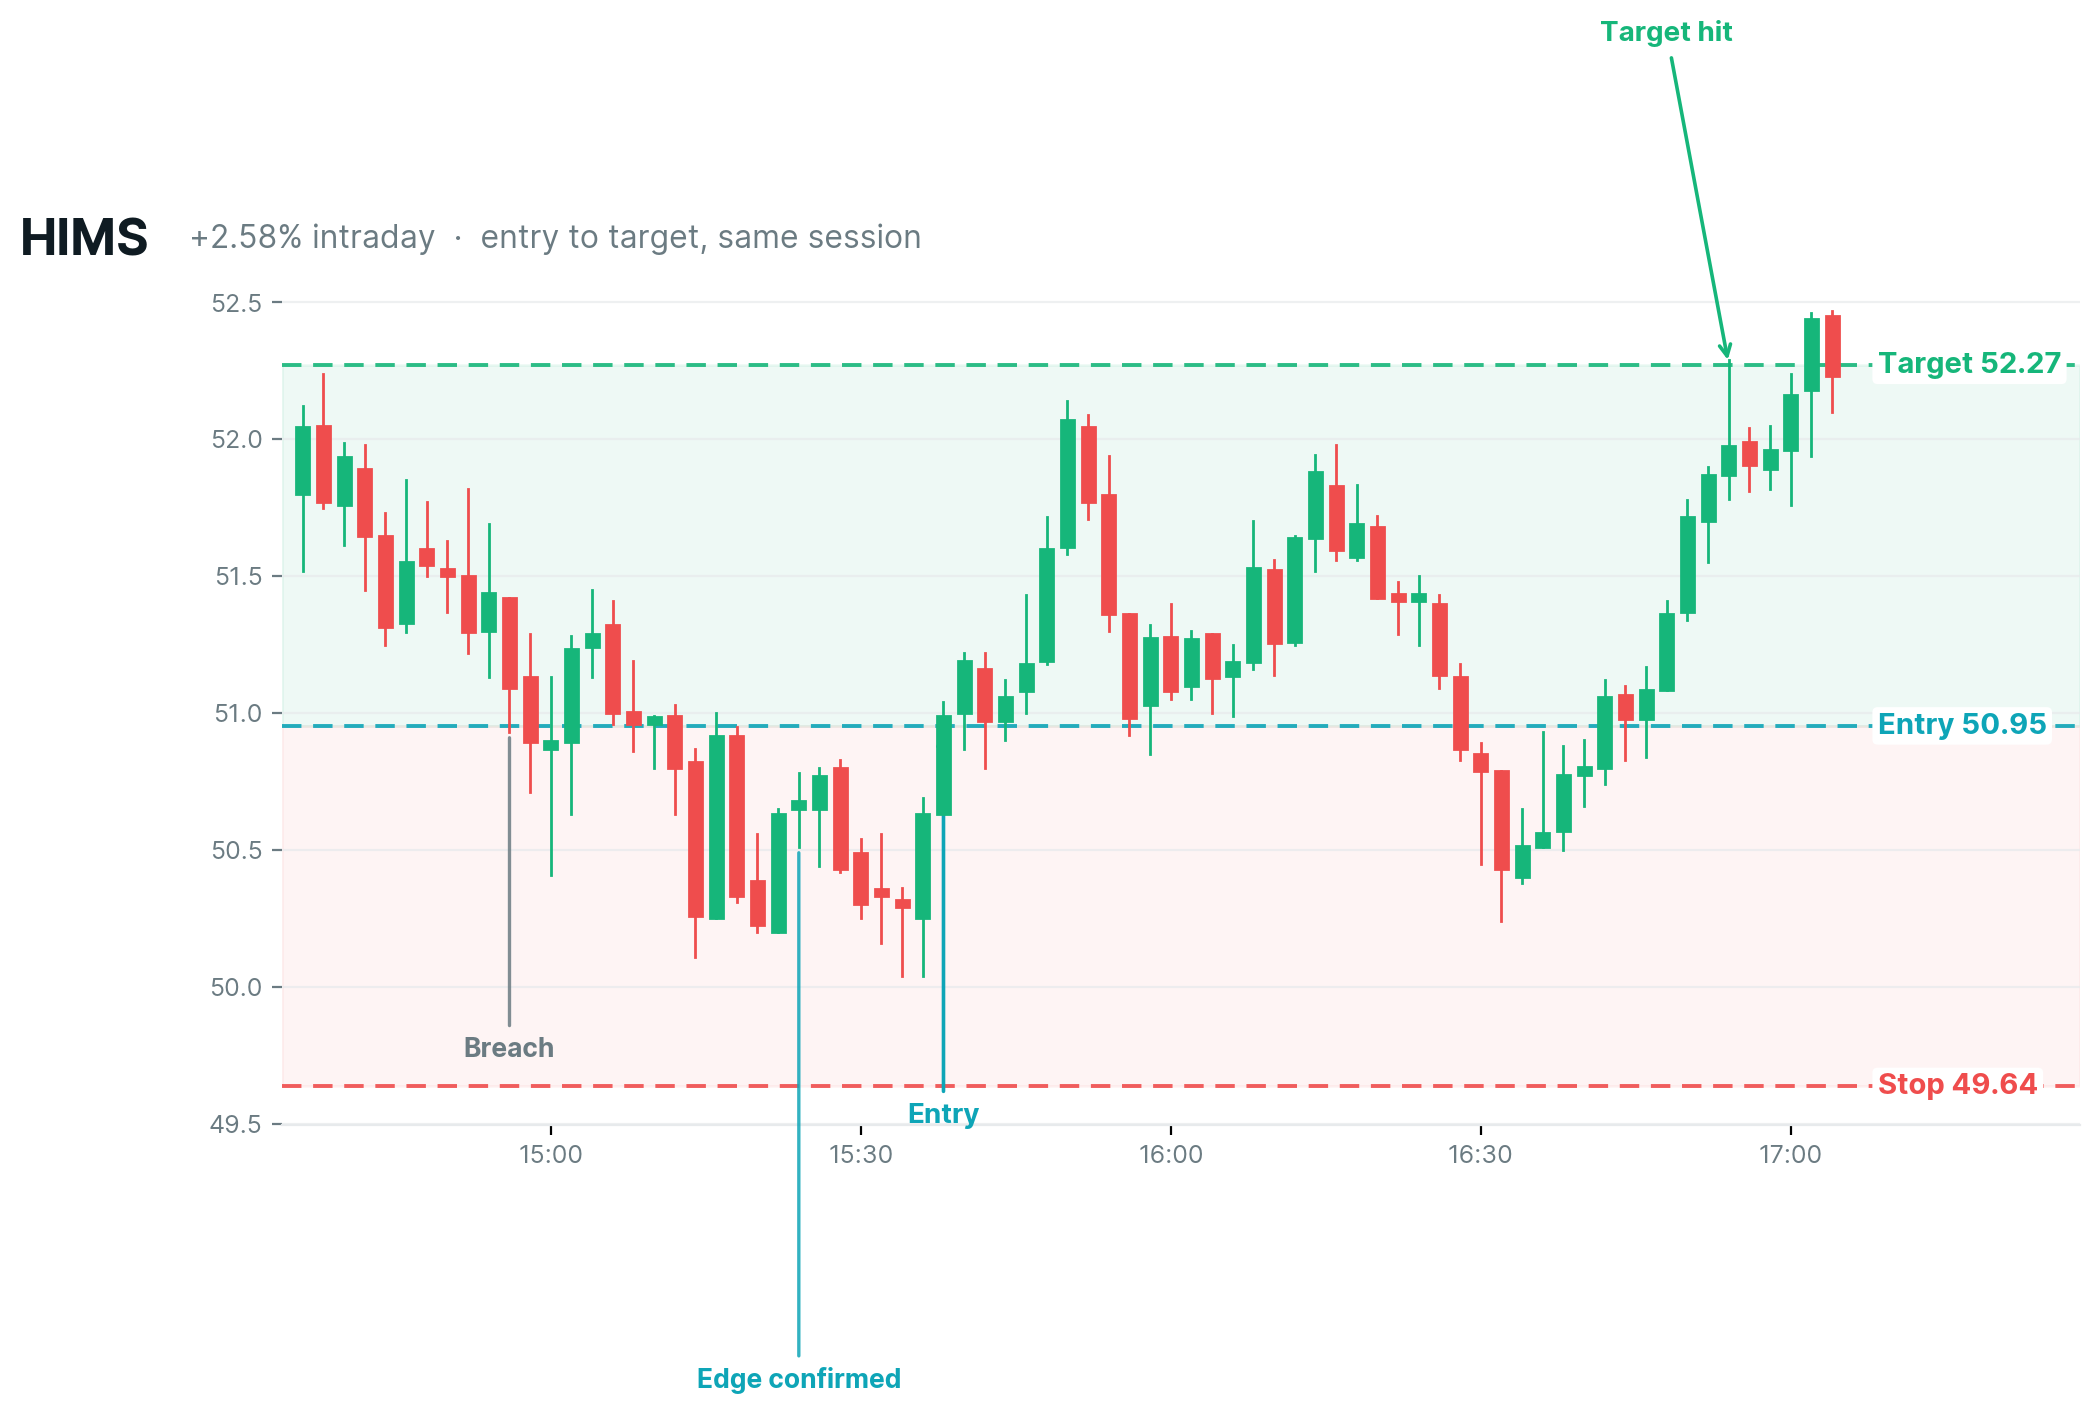
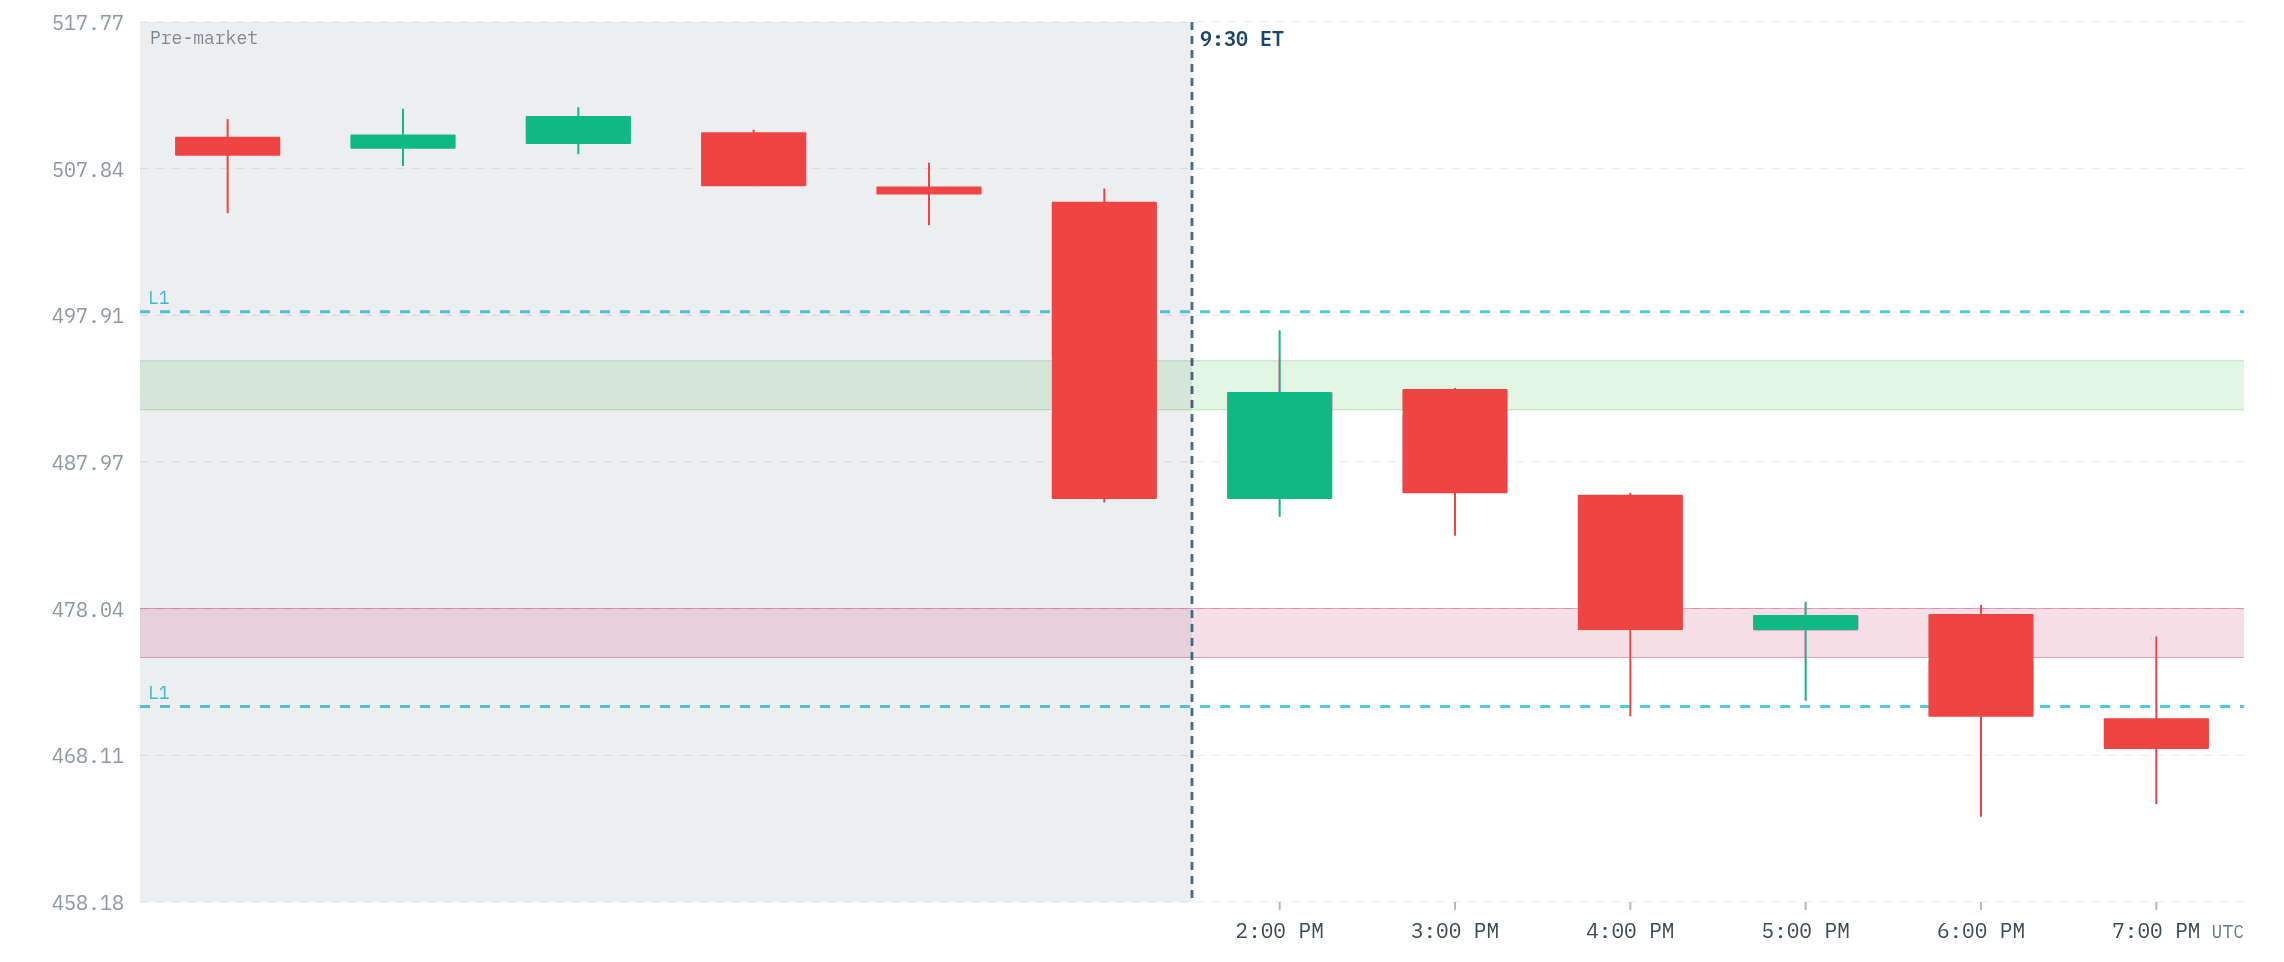
Pinpoint the level where the setup is valid.
Not just a market to watch, but the price where the trade makes sense, with the trend behind you and the volatility in your favor.
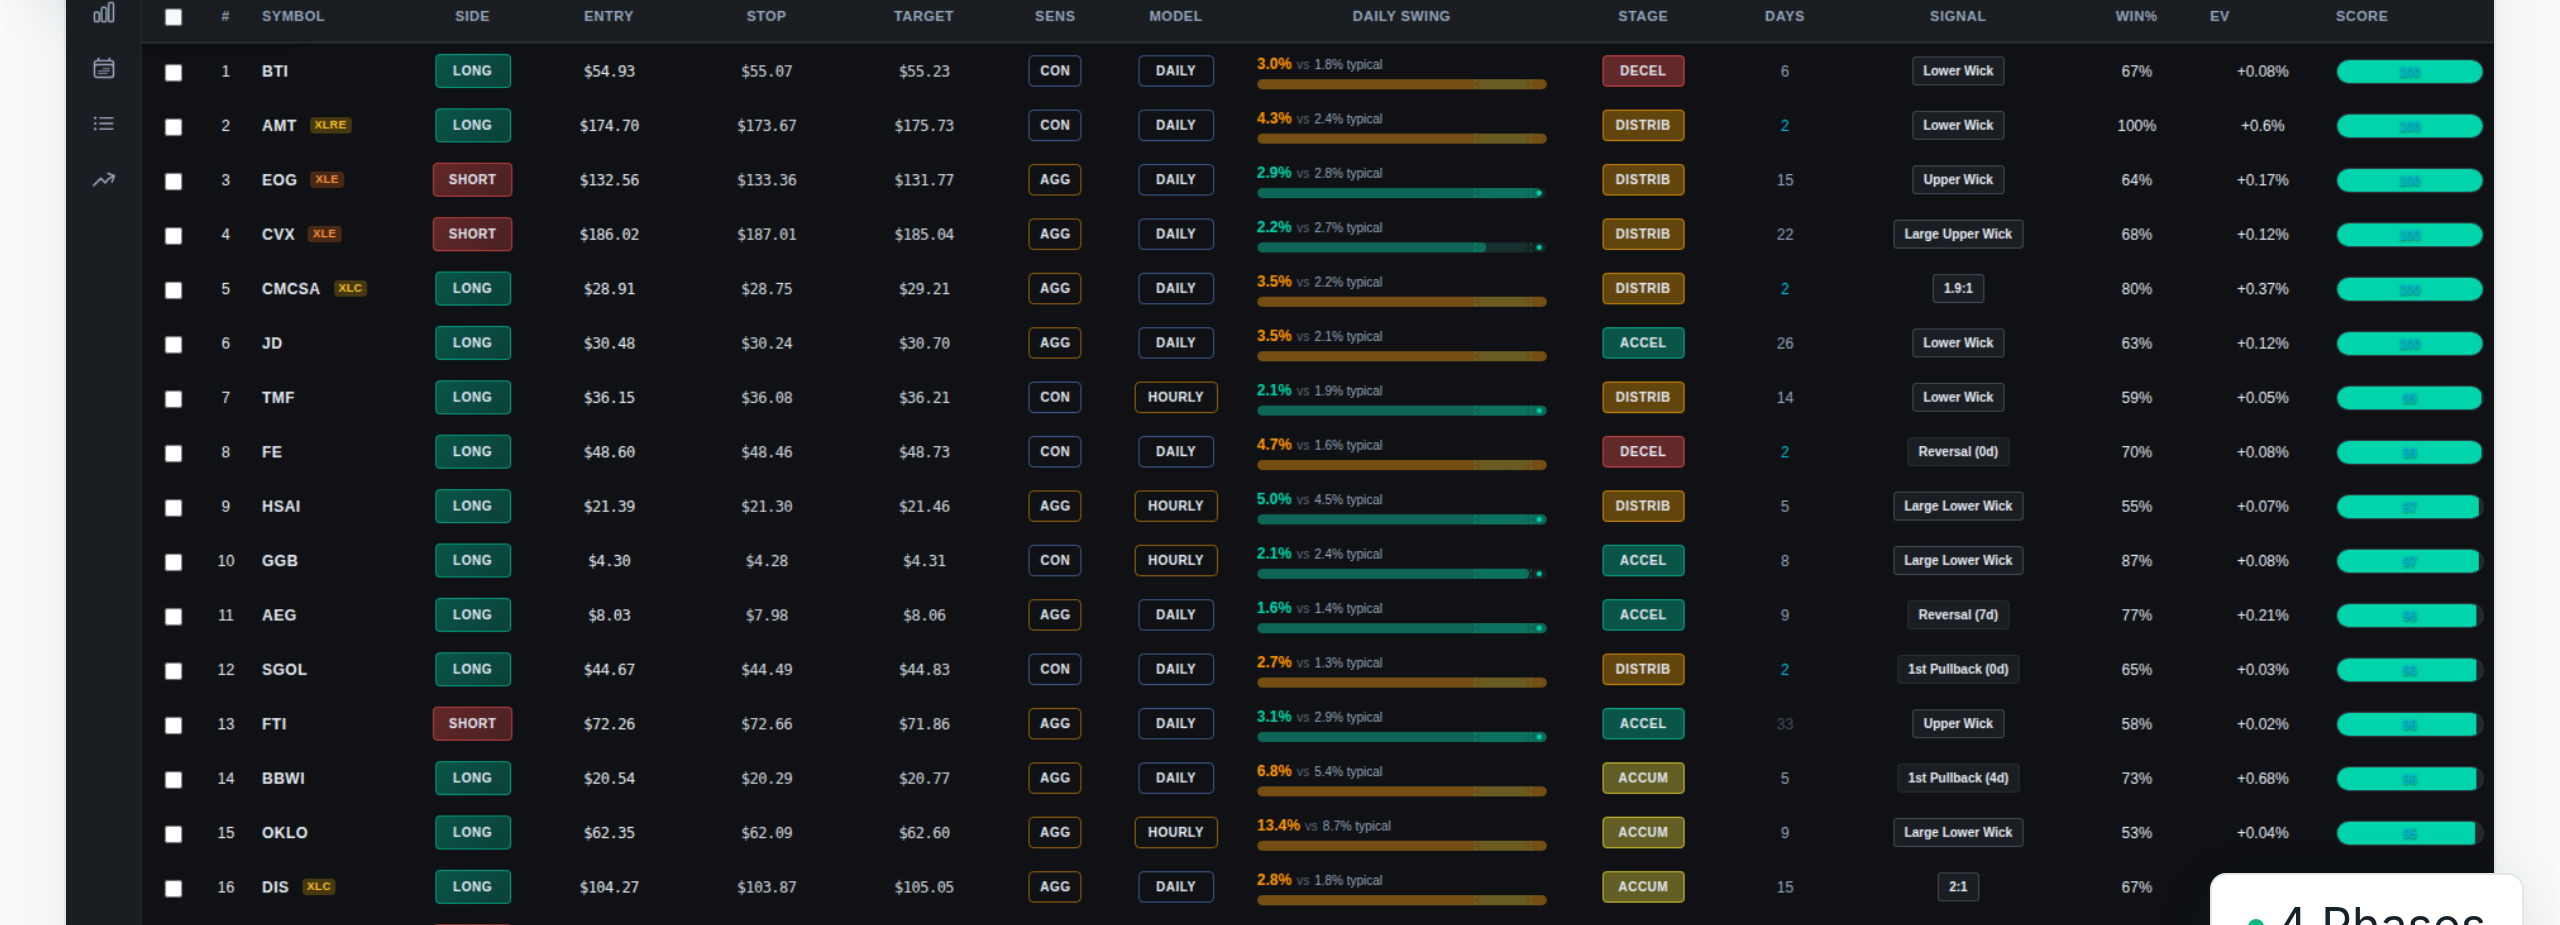
One scanner, with every model built in.
Every market is read through daily and hourly volatility models. The daily models frame the larger move and where volatility is likely to expand. The hourly models find the moment and the level to enter.
The daily models frame the larger move.
They map where a market is likely to reverse and where a break is likely to keep trending over the session, so you know which names deserve your attention before the open.
The hourly models find the entry.
They follow the move level by level through the day and tell you the moment a market lines up, not an hour after it already has.
Trade with the trend, or take the swing.
The same read keeps you on the right side of the move and surfaces longer swing setups when a market lines up for a larger run, so your trend trades and swing trades come from one place.
Know which way the market is leaning before you trade.
Market Pulse reads the trend across every name we cover and places each one in one of four phases, each with its own color. You know whether to lean in or wait before you ever look at a chart.
Yellow
Price is firming up but the uptrend is not confirmed yet. An early, building phase worth watching rather than chasing.
Green
The uptrend is confirmed and in control. This is where leaning long and holding with the trend has the most going for it.
Orange
Price is rolling over but the downtrend is not confirmed yet. Momentum is fading, so tighten up rather than press longs.
Red
The downtrend is confirmed and in control. Conditions favor leaning short or standing aside, not fighting the move.
One price, for the whole platform.
The scanner, the daily and hourly models, the regime read, and both trend and swing setups. No tiers and no upsells. Cancel whenever you like.
- The full scanner across 600+ stocks and ETFs
- Daily and hourly volatility models
- A real-time regime read, updated all session
- Trend-aligned entries and longer swing setups
- Exact entry levels, not just a list of symbols
Frequently asked questions
What does Volatility Box do?+
It reads the liquid markets where institutions trade through daily and hourly volatility models, then tells you when you have an edge, which direction the trend favors, and the level where you should enter.
What are the daily and hourly models?+
Two reads on the same market. The daily models frame the larger move and where volatility is likely to expand. The hourly models pinpoint the intraday entry. Together they answer both where to act and when.
Can I trade with the trend, or swing trade?+
Both. The read keeps you on the right side of the move, and the same setups surface swing trades when a market lines up for a larger run.
Is this financial advice?+
No. Volatility Box is an educational research tool. Every decision and every trade stays in your hands.
Can I cancel?+
Any time, in two clicks. No contracts and no retention games.
See where your edge is today.
Stop guessing which market, which direction, and when. Let the models show you.