VB Short Interest
Why Confluence Matters
Trading high short interest alone produces mediocre results with approximately 35-40% win rate. Many heavily-shorted stocks continue falling because shorts are fundamentally correct about deteriorating fundamentals or business problems.
Volatility Box LONG signals alone deliver respectable 58-64% win rate, which is profitable but leaves room for improvement. However, when you combine both factors, requiring a VB LONG signal on a stock with high short interest and trapped shorts, the win rate jumps dramatically to 68-75% with average wins 2-3x larger due to squeeze dynamics amplifying the move beyond normal technical targets.
This makes Volatility Box plus short interest confluence one of the highest-probability setups in the entire VB system, worth focusing on for outsized returns and maximum edge.
Double Confirmation Requirements
Never trade a squeeze setup without both confirmations met simultaneously. Either factor alone is insufficient for high-probability success.
Confirmation 1: Short Interest Metrics
- Short % greater than 15% minimum (20%+ strongly preferred for meaningful squeeze potential)
- Days to Cover greater than 3 minimum (5+ strongly preferred for truly trapped shorts)
- Float below 200 million shares (smaller float equals easier squeeze due to limited supply)
Confirmation 2: VB Signal Requirements
- Direction: LONG only (squeezes create upward price pressure from forced buying)
- Conviction: 80+ minimum (ensuring high-quality setup with strong statistical backing)
- Model preference: Daily Conservative (provides wider stops to accommodate squeeze volatility)
- Market Pulse: TR (Trend Reversal) or FP (First Pullback) signal types preferred
Example: CVNA Confluence Setup
Consider CVNA as a concrete example where both confirmations are perfectly met.
Short Interest Data (from Short Interest Scanner):
- 34.2% short percentage
- 8.2 Days to Cover
- 142M float (all passing quantitative filters)
VB Signal Data (from main Scanner):
- Direction: LONG
- Entry: $18.40
- Stop: $16.80
- Target: $22.60
- Conviction: 82
- Model: Daily Conservative
- Market Pulse: Yellow with TR signal (Trend Reversal indicating major turn)
The confluence assessment confirms both confirmations are definitively met, making this a high-probability squeeze trade worth taking with real capital. This systematic verification process removes guesswork and emotional decision-making.
Confluence Workflow
The systematic workflow for finding Volatility Box plus Short Interest confluence setups involves three steps executed in sequence.
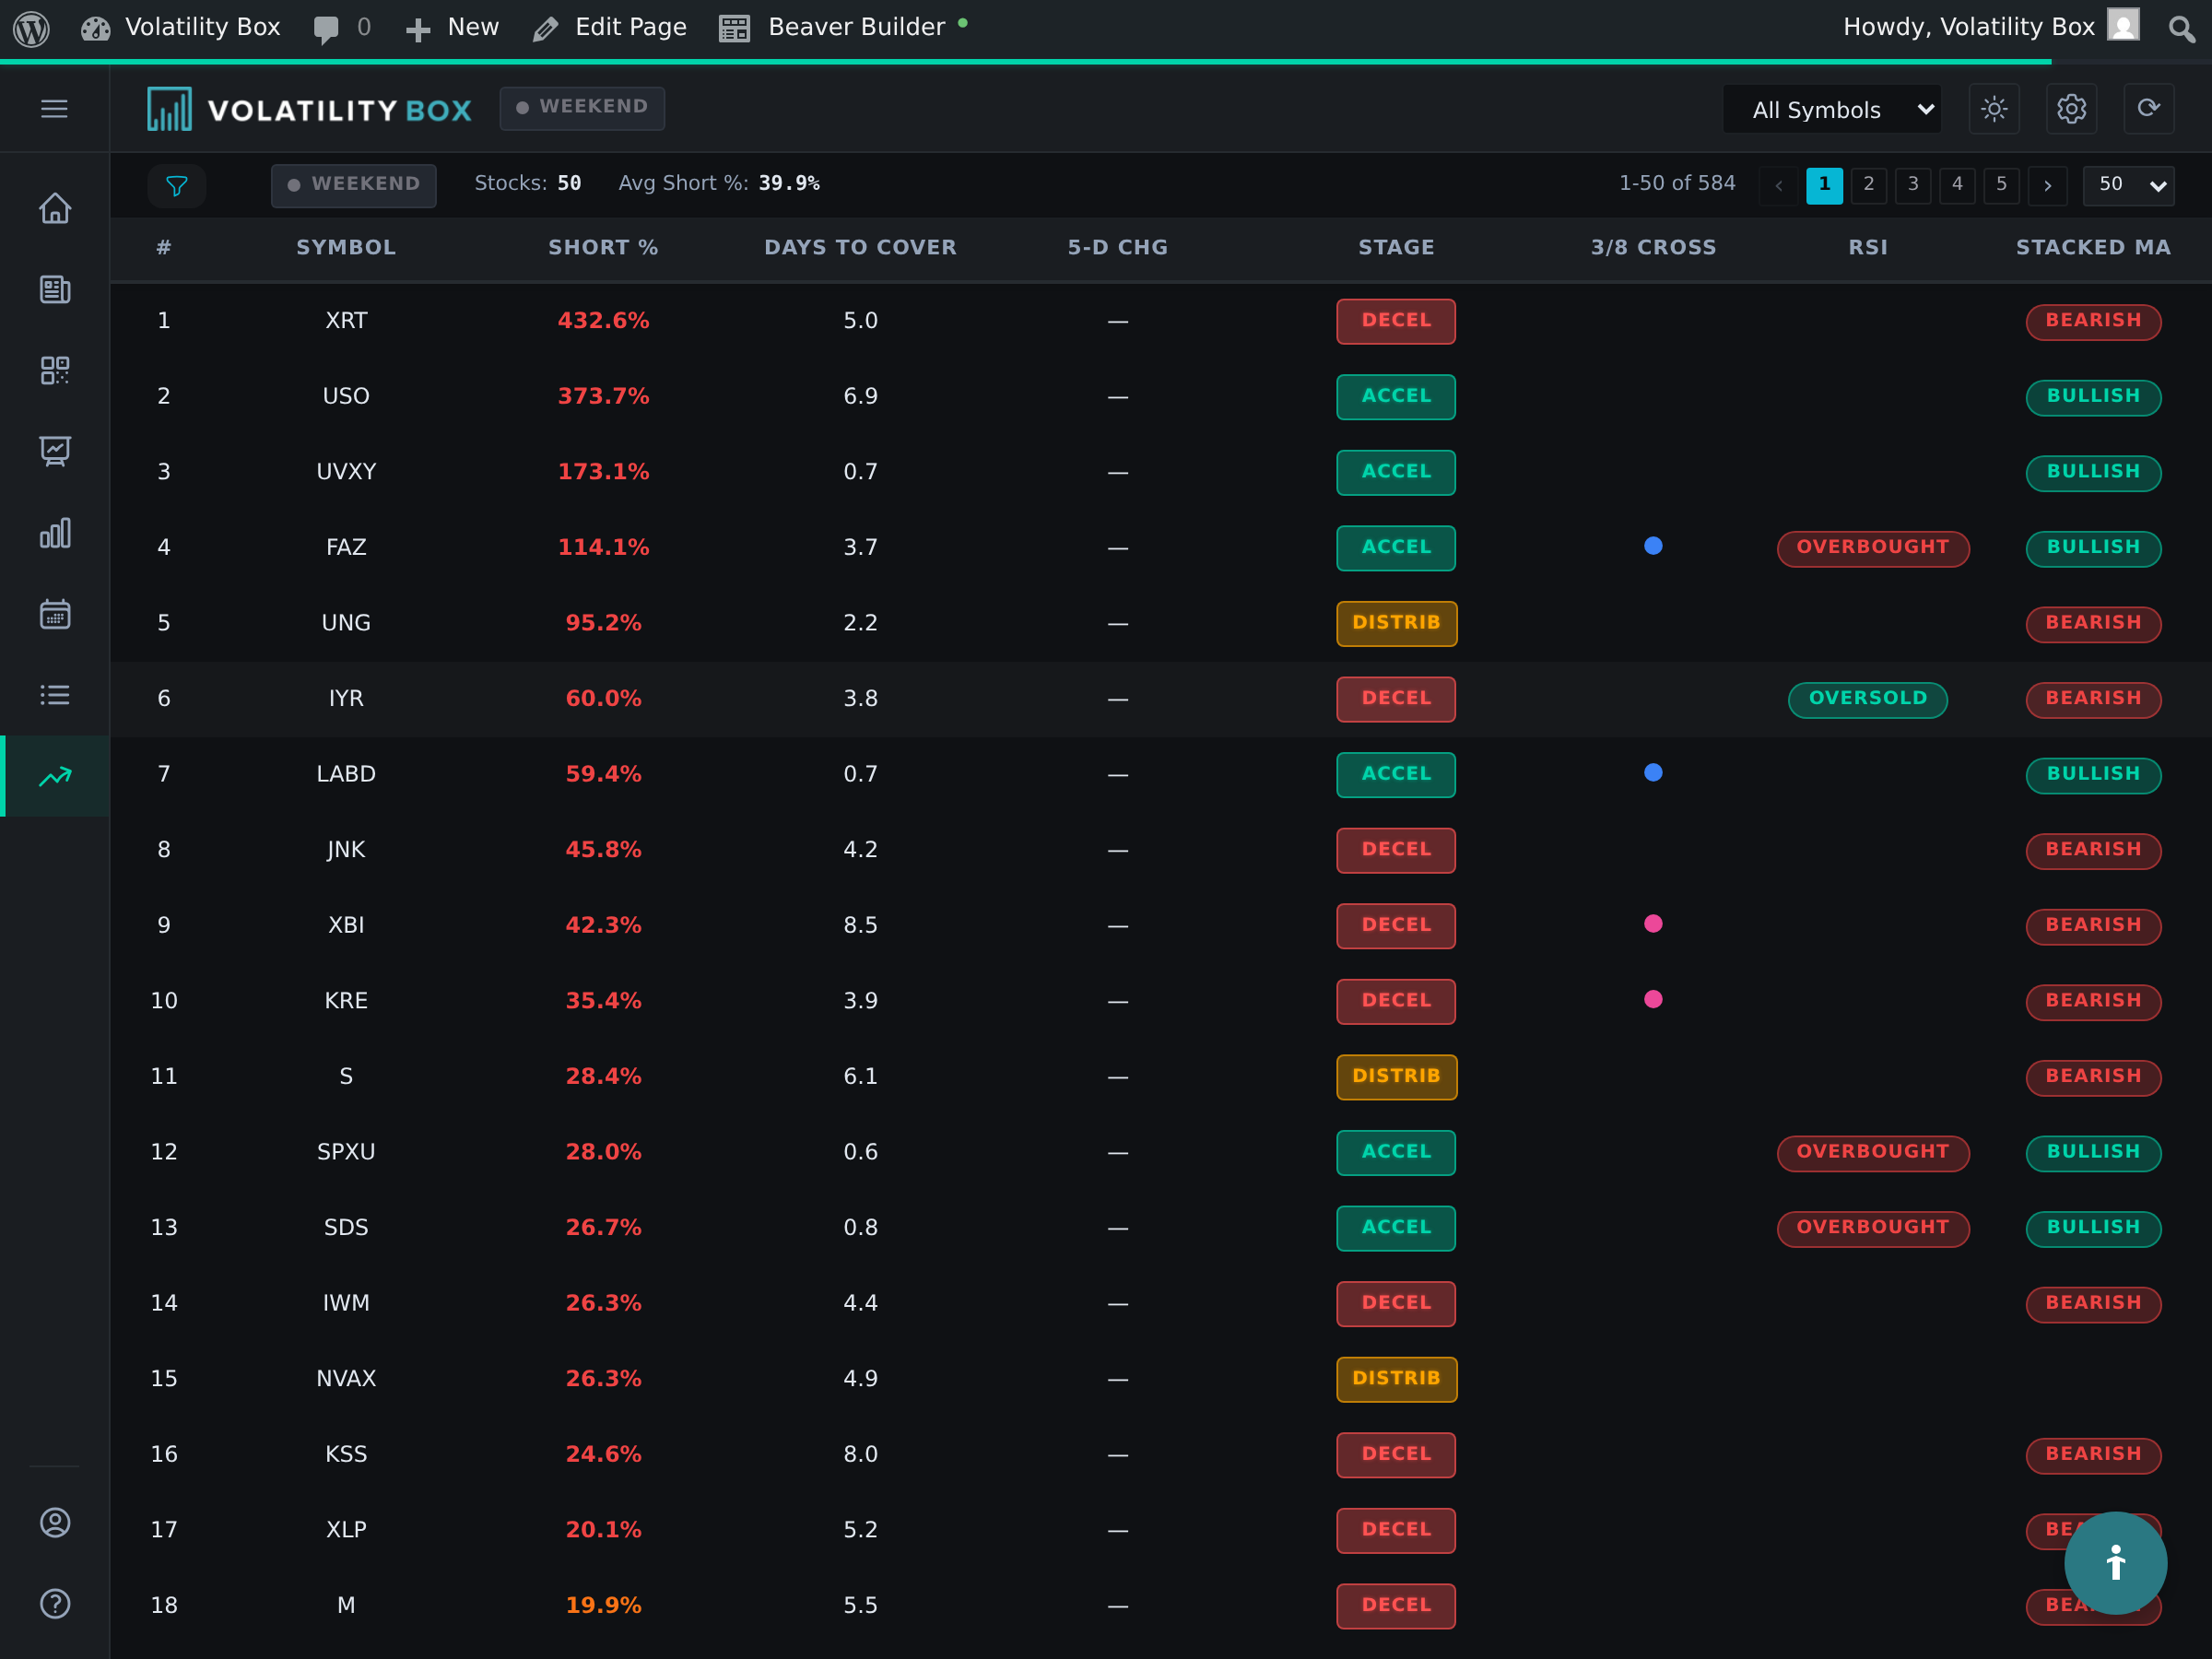
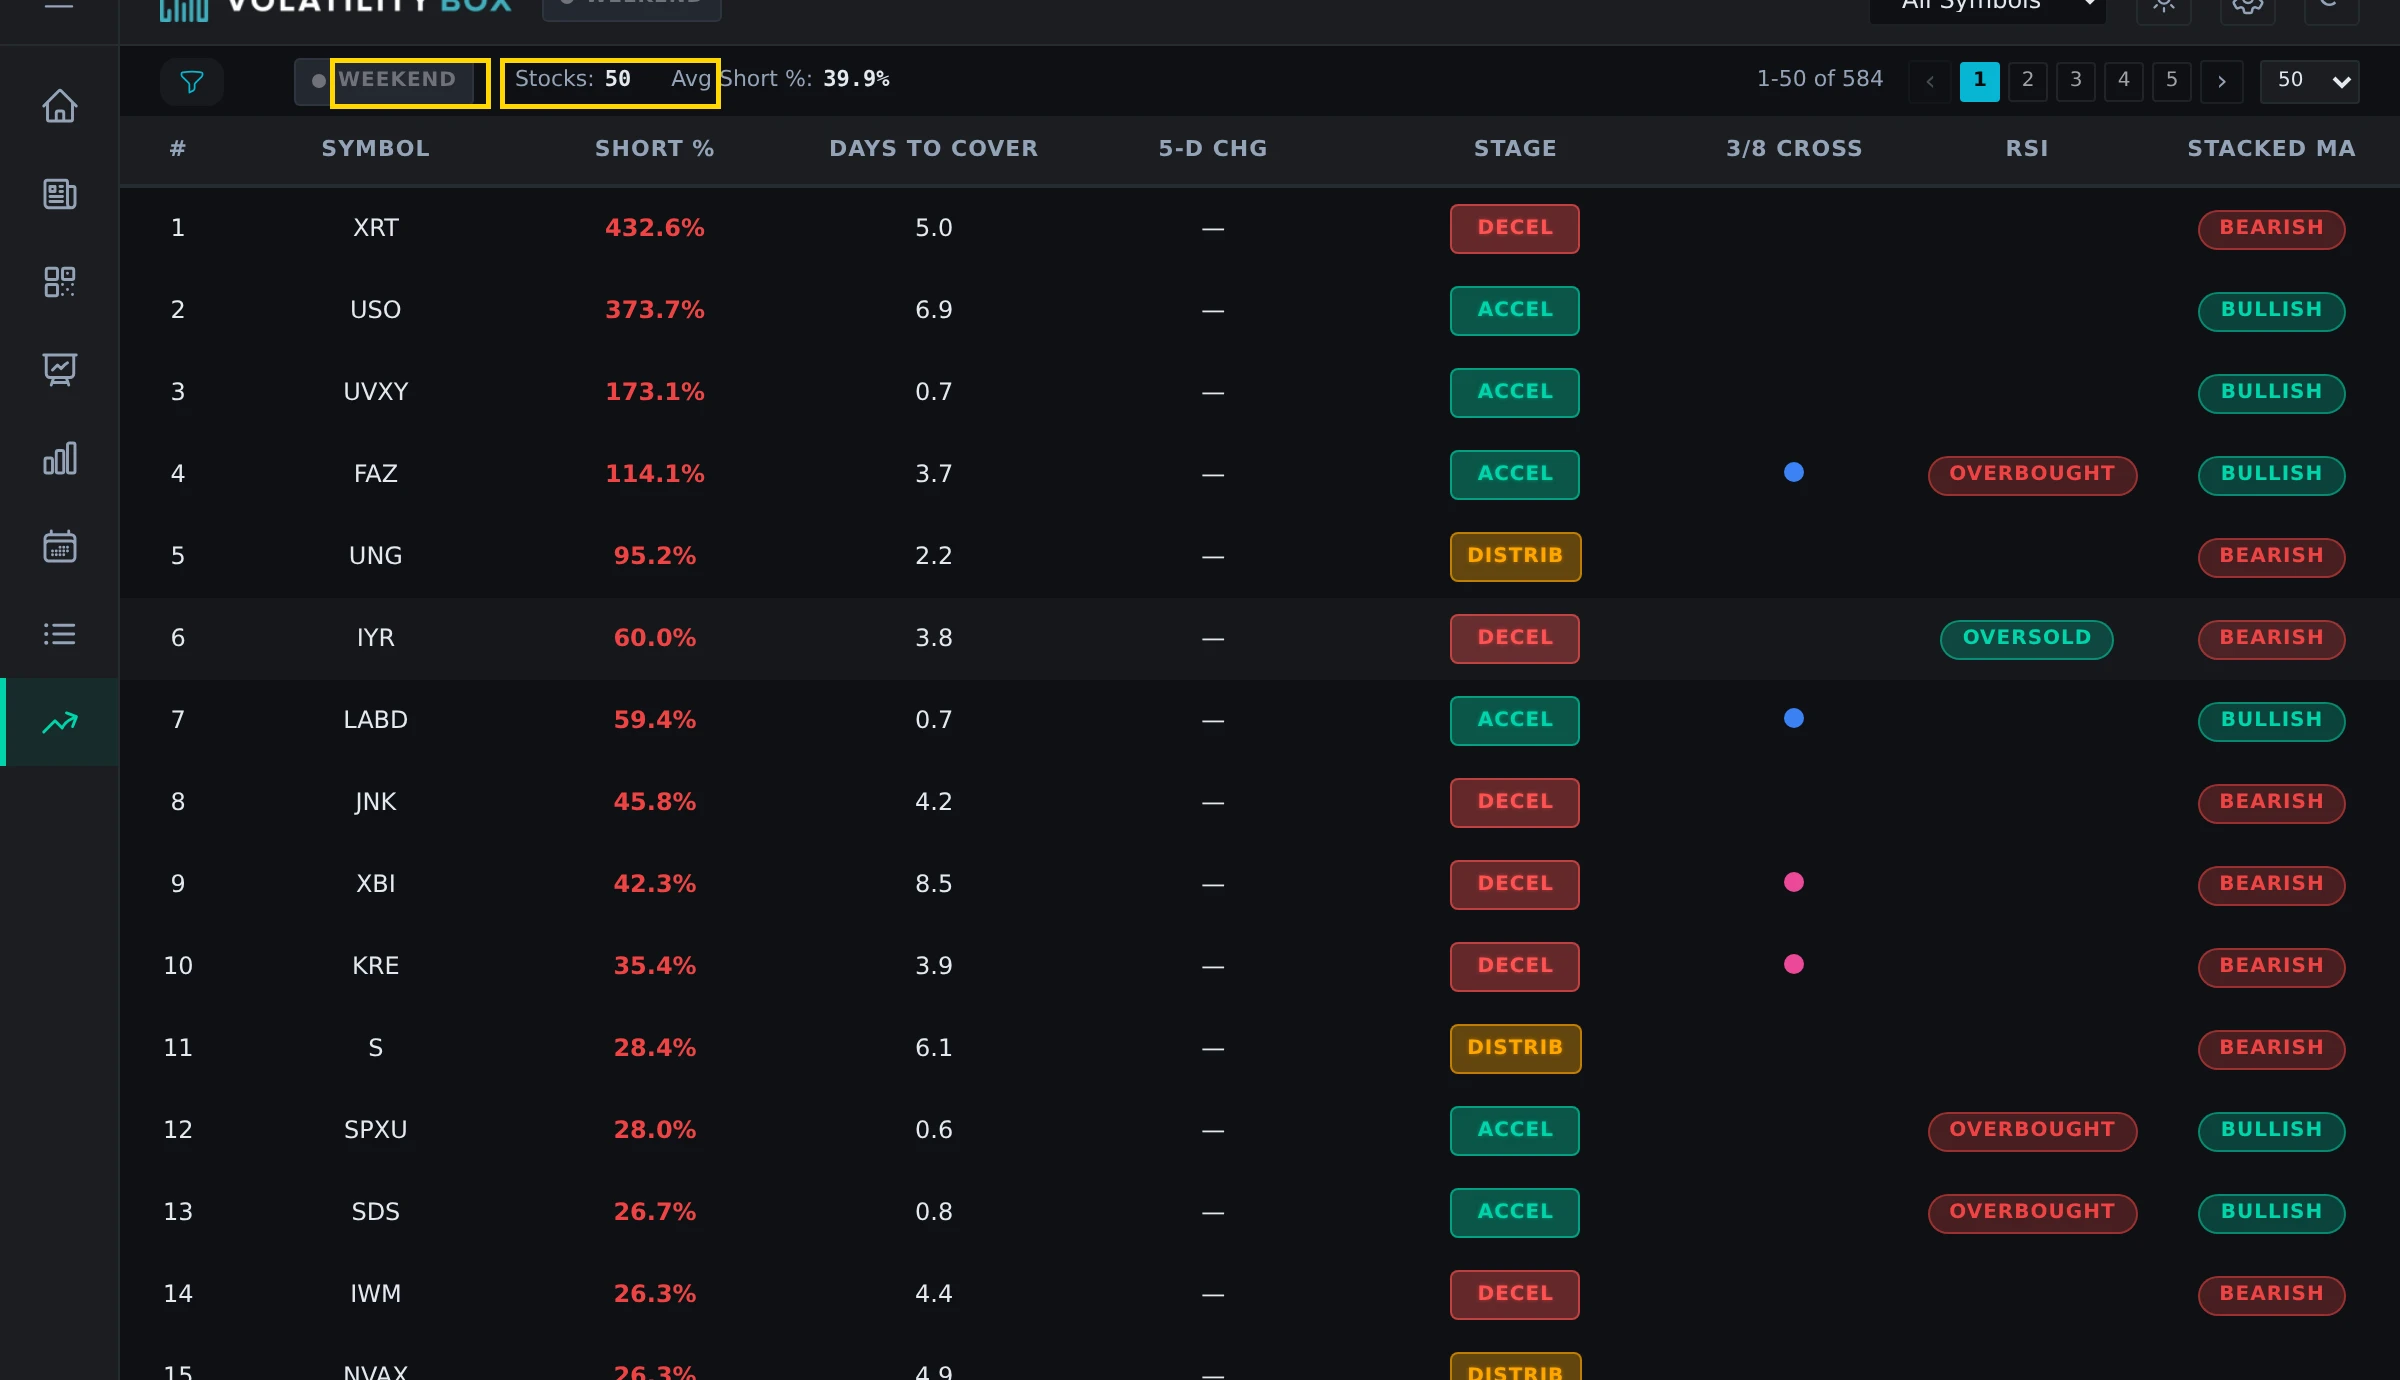
Step 1: Identify High Short Interest Candidates
Open the Short Interest Scanner by clicking the Short Interest tab in the sidebar. Sort the table by Short % to view the most heavily shorted stocks first. Identify candidates with Short % above 20% and Days to Cover above 5 by scanning down the sorted list. Write down the top 10 symbols that meet both criteria.
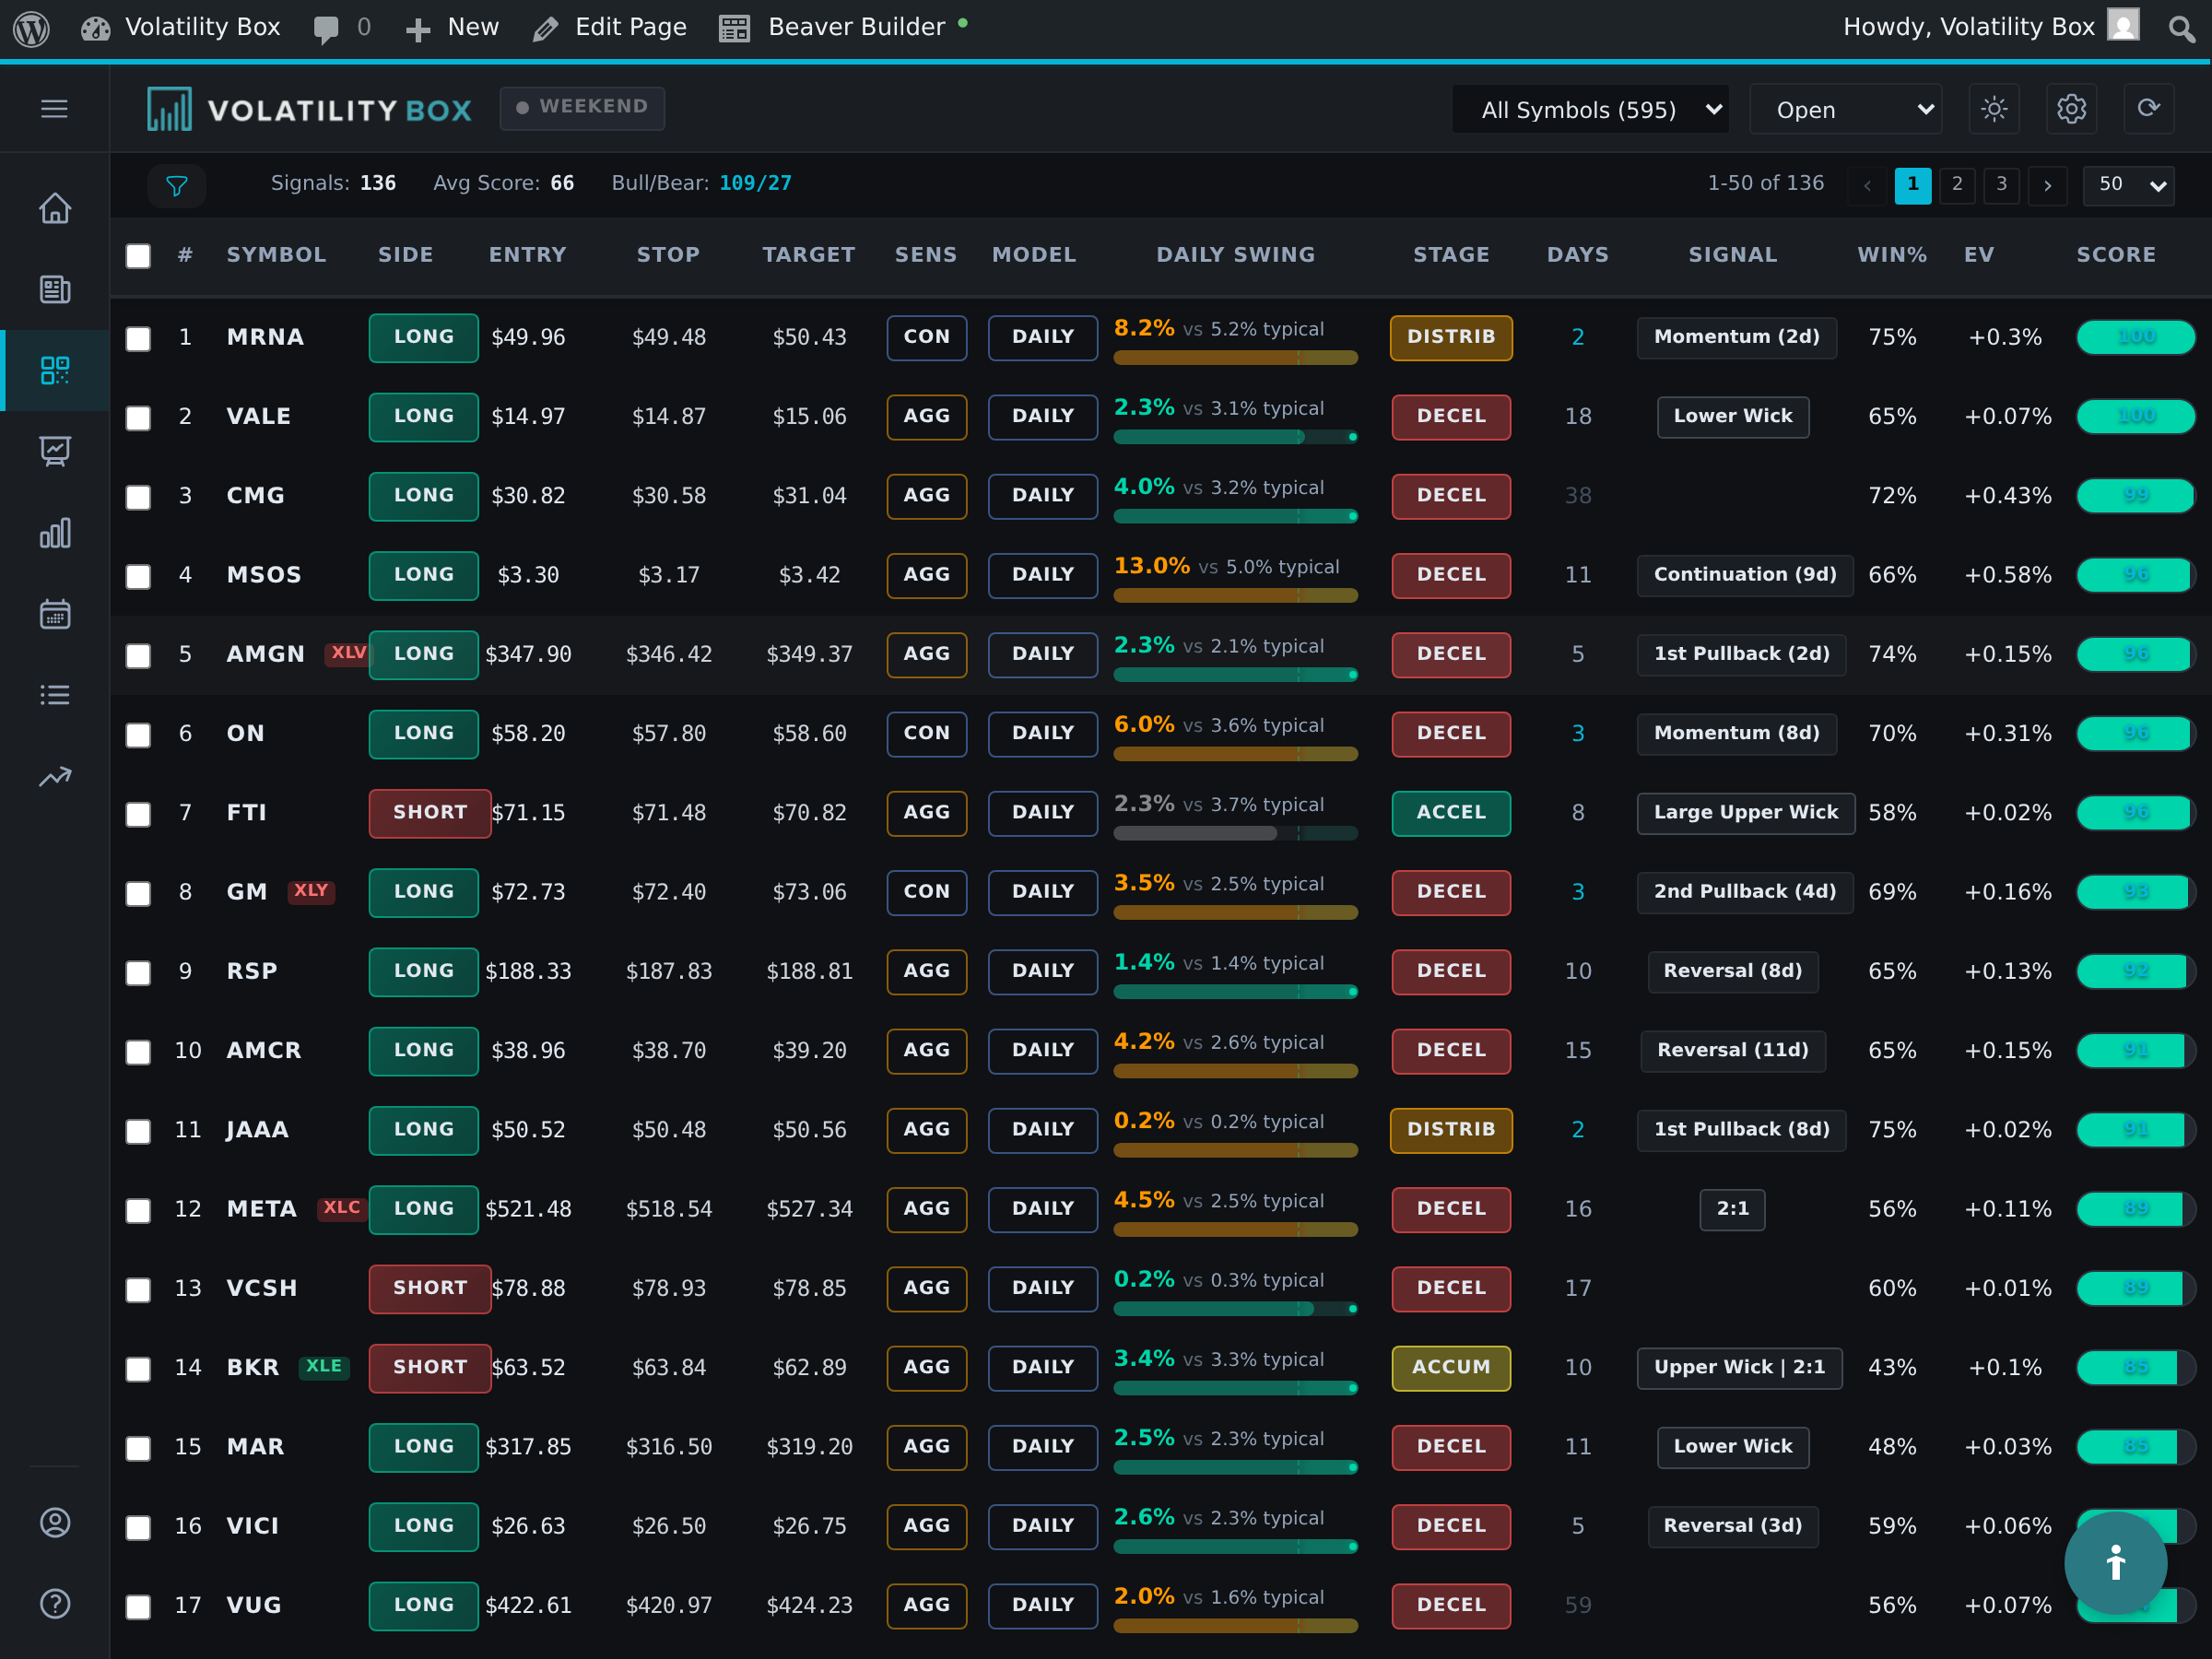
Step 2: Cross-Reference with Volatility Scanner
Open the main Volatility Scanner and use the search or filter functionality to check each of your 10 short interest candidates. Look for LONG signals with conviction above 75 and Market Pulse alignment showing WITH trend or TR/FP signal types. Note which symbols have active VB signals that meet your criteria.
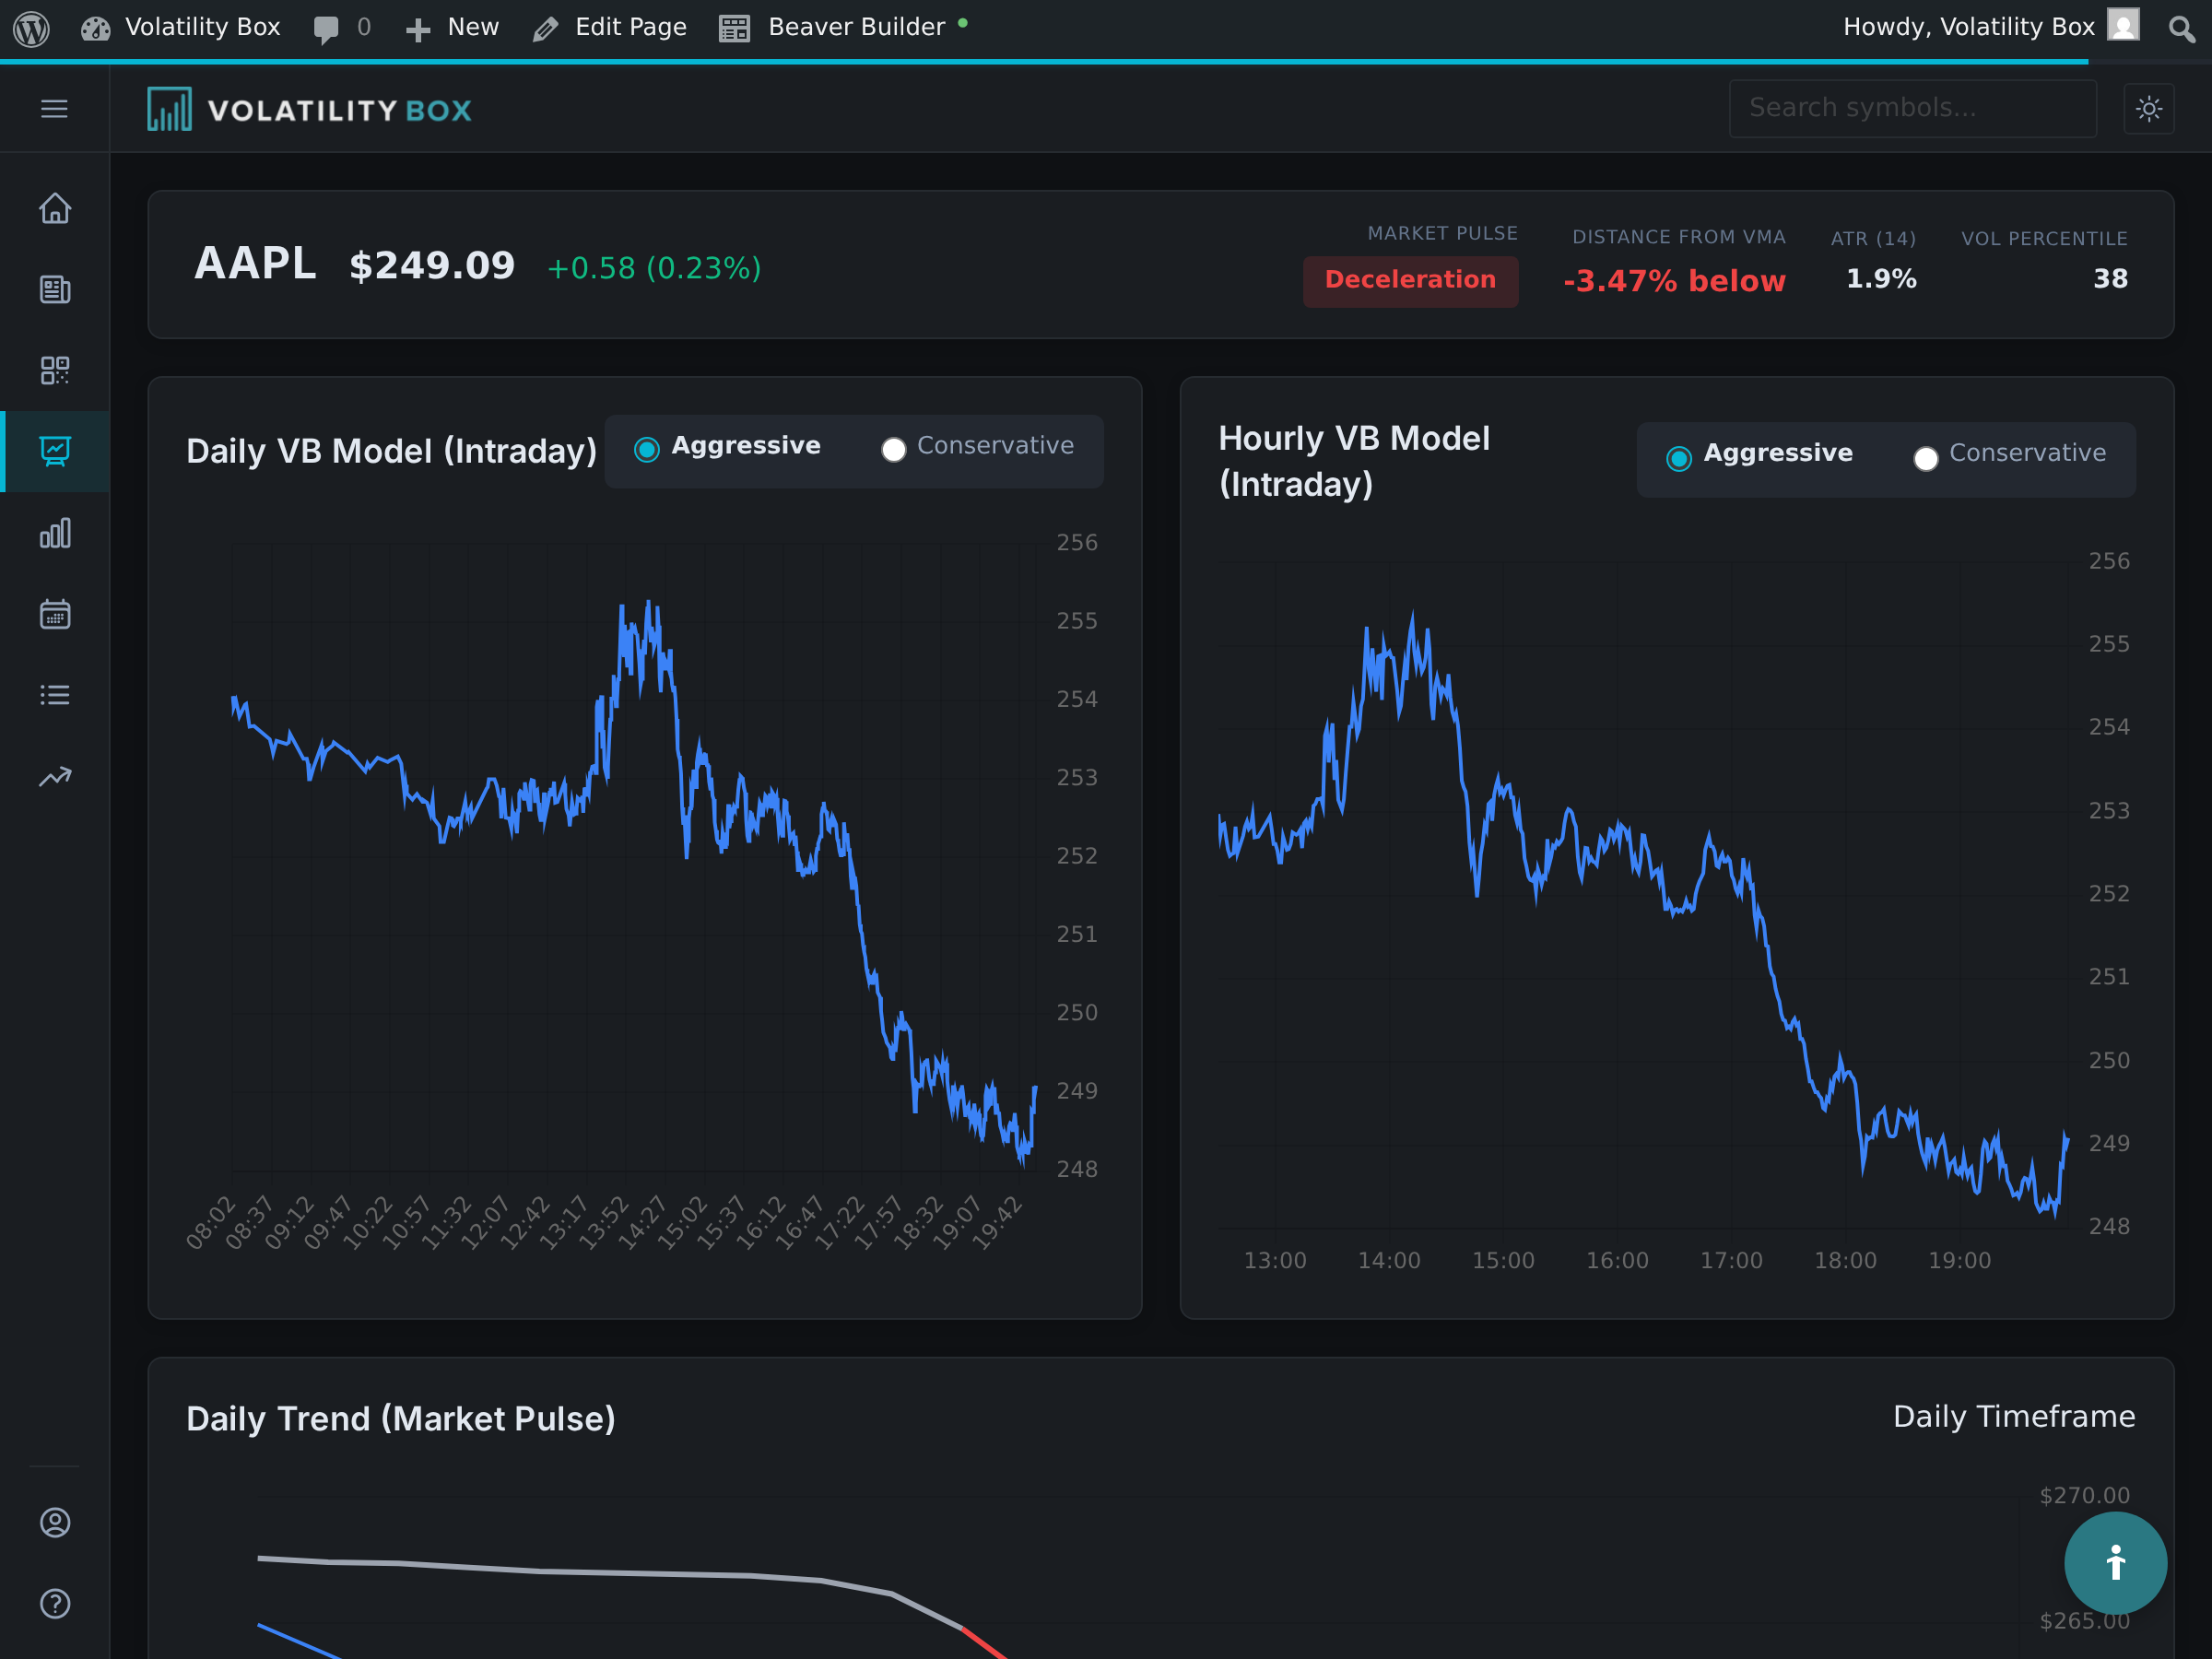
Step 3: Visual Confirmation on Symbol Page
For any symbol that appears on both lists (high short interest AND active VB LONG signal), open the Symbol Page to visually confirm the setup. Verify that price is at the VB entry level, check that support exists nearby, and review recent candle patterns for reversal confirmation. If all visual checks pass, this becomes a trade candidate worth deeper analysis and potential entry.
Confluence Criteria Details
The minimum viable squeeze setup requires VB LONG signal with conviction 75+, Short % greater than 15%, and DTC greater than 3 days. This combination produces approximately 55% win rate (modestly profitable but not exceptional).
The ideal squeeze setup requires VB LONG signal with conviction 80+, Short % greater than 25%, DTC greater than 5 days, and Market Pulse showing TR or FP signals. This combination produces approximately 70% win rate or higher (highly profitable with strong edge).
Understanding this spectrum helps you calibrate position sizing and risk tolerance based on setup quality. Take larger positions on ideal setups approaching full squeeze size and smaller positions on minimum viable setups at reduced size.
8-Point Scoring System
Use this scoring system to objectively rate each potential squeeze trade before entry, eliminating emotional bias. Award 1 point for each factor:
- VB Conviction 80+ (1 point)
- Short % greater than 20% (1 point)
- DTC greater than 5 (1 point)
- Market Pulse TR or FP (1 point)
- Historical win rate 60%+ for this symbol and strategy (1 point)
- RSI below 35 showing oversold (1 point)
- Volume greater than 1.5x average (1 point)
- Darvas support nearby providing a floor (1 point)
Score interpretation:
- 8/8: Perfect setup worth maximum position size at 1% risk
- 6-7/8: Strong setup worth normal squeeze size at 1% risk
- 4-5/8: Marginal worth half size at 0.5% risk or skip entirely
- Below 4/8: Skip, insufficient confluence exists for high-probability success
Technical Overlay Confirmation
Add technical indicators beyond VB signals to provide additional confirmation layers that increase setup quality and probability.
RSI Oversold Bounce Confirmation
Check the RSI (14) indicator on your charting platform’s daily chart:
- RSI below 30 indicates oversold conditions good for squeeze reversals
- RSI 20-25 indicates extremely oversold where best setups occur
- RSI below 20 indicates panic selling with strong reversal potential
For example, BYND might show RSI dropping to 22 on January 10, then VB LONG signal triggering at $8.50 on January 11, followed by RSI bouncing to 28 confirming the reversal. The combination of oversold plus VB signal plus short squeeze creates a high-probability trade with multiple independent confirmation factors.
EMA Crossover Confirmation
Look for bullish EMA crosses on the daily chart where 8 EMA crosses above 21 EMA. This indicates short-term momentum is reversing upward and the downtrend is definitively breaking.
For example, W (Wayfair) might show 8 EMA crossing above 21 EMA on January 12, VB LONG signal triggering the same day at $42.80, and short interest at 26.9% with 7.8 Days to Cover. The EMA cross plus VB signal plus squeeze metrics creates powerful confluence suggesting trapped shorts are about to face significant covering pressure.
Stacked Moving Averages
Another valuable confirmation layer shows when price is below all EMAs (8, 21, 50), which signals extreme bearishness and prime reversal setup.
Specifically, look for stacked bearish configuration where Price is below 8 EMA, which is below 21 EMA, which is below 50 EMA. This indicates maximum bearish sentiment. When Volatility Box triggers while price is below all EMAs and short interest is high, shorts are maximum complacent and confident in their positions, making the reversal more violent when it occurs.
Market Pulse Signal Types
Market Pulse signal types provide context about where price sits in its cycle. Certain signal types work dramatically better for squeeze trades.
Best Market Pulse Signals for Squeezes
- TR (Trend Reversal): A major trend change has been detected and shorts are caught wrong-footed at a turning point
- FP (First Pullback): The first retracement in a new uptrend where shorts are adding to positions at exactly the wrong time
- SP (Support Play): A bounce off major support where shorts expected breakdown but got reversal instead
Signals to Avoid for Squeeze Trades
- TC (Trend Continuation): The stock is already trending upward, meaning the squeeze likely already played out and you’re late
- ME (Mean Extension): An extended move where exhaustion risk is elevated and reversal probability is high
These negative signal types should make you skip the trade even if short interest looks very appealing, as the technical setup doesn’t support a squeeze trade at this point in the cycle.
Example: CVNA with TR Signal
CVNA drops from $48 to $16 over 6 months as shorts pile in aggressively, building a massive short position totaling 34% of float. Market Pulse flips to TR (Trend Reversal) on January 12, indicating the downtrend is definitively breaking. VB LONG signal triggers at $18.40 on January 13 with conviction 82. Short interest stands at 34.2% with high DTC of 8.2 days.
The TR signal tells you the downtrend is definitively broken and shorts who were comfortably profitable for months are now trapped as price reverses violently against them. This confluence of TR signal, VB breach, and heavy short interest creates one of the highest-probability squeeze setups you can find.
Entry Timing Discipline
Don’t buy just because short interest is high or because Reddit is hyping a stock. Wait for proper technical setup or you’re gambling rather than trading with edge.
Entry Checklist
Four confirmations required before taking the trade:
- VB signal triggers: Price breaches VB lower band and LONG signal appears in Scanner
- Reversal candle forms: Hammer, bullish engulfing, or morning star on daily chart confirming the turn
- Volume confirms: Volume greater than 1.5x average on reversal day showing buying pressure
- RSI turns upward: RSI was below 30 and is now moving higher confirming momentum shift
Enter on the close of the reversal day if all criteria are met, or the next morning if the setup remains intact with price holding above the VB entry level. Never enter before these confirmations appear, even if short interest looks amazing.
Example: BYND Entry Timing
January 10 (Day 1): BYND closes at $8.20, down 8% on the day, with high short interest known from Scanner but no VB signal yet. Action: watch only, don’t enter under any circumstances.
January 11 (Day 2): VB LONG signal triggers at $8.50, hammer candle forms with long wick to $8.10 before closing at $8.65, volume explodes to 22M (2.6x average), and RSI rises from 24 yesterday to 31 today showing turn upward. Action: enter at $8.65 as reversal is definitively confirmed with all four criteria met.
Risk Management with VB Stops
Use the VB stop provided by the Scanner without widening it, even though you might be tempted to “give the squeeze more room” to develop. VB stops are calculated based on the stock’s specific volatility profile. If price breaks below the VB stop, the reversal thesis is definitively invalidated and you need to exit immediately.
For example, CVNA might have entry at $18.40, VB stop at $16.80, and risk per share of $1.60. If CVNA breaks below $16.80, the squeeze isn’t happening and you exit immediately to preserve capital for better opportunities. Hope is not a trading strategy and leads to large losses.
Stop Discipline Rules
- Never move stops wider hoping the squeeze will still happen
- Never hold through stop breakdown rationalizing that “it’s so heavily shorted, it has to squeeze eventually”
- Exit immediately when the stop hits, don’t wait until end of day hoping for a miracle recovery
Squeeze trades are inherently higher risk than normal VB trades, making stop discipline even more critical for long-term survival and success.
Position Sizing Adjustment
Squeeze trades are significantly more volatile than standard VB trades. Reduce position size to maintain consistent risk exposure across your portfolio.
Normal VB trades: Account size $50,000 with risk of 2% per trade equals $1,000 maximum loss.
Squeeze trades: Account size $50,000 with risk of 1% per trade equals $500 maximum loss. This represents a 50% position size reduction that accounts for the elevated volatility.
Position Sizing Calculation Example
For a CVNA squeeze trade:
- Account: $50,000
- Risk: 1% = $500
- Entry: $18.40
- Stop: $16.80
- Risk per share: $1.60
- Position size: $500 / $1.60 = 312 shares
For comparison, a normal VB trade with $1.60 risk per share would be $1,000 / $1.60 = 625 shares. Squeeze trades receive exactly half the position size of normal trades, protecting you from the unique risks while still allowing meaningful profit potential.
Two-Target Profit Strategy
Manage squeeze trades using a two-target approach that locks in profits while maintaining exposure to potential explosive moves.
Target 1 (VB target): Exit 50% of your position when the VB target price is hit, locking in profit and significantly reducing risk on the remaining position.
Target 2 (squeeze extension): Trail the remaining 50% using 8 EMA or VB bands, letting it run if the squeeze ignites and creates a parabolic move beyond the initial target. Exit when price closes below 8 EMA or shows clear exhaustion signals.
Profit-Taking Example: CVNA
Entry at $18.40 for 312 shares, VB target at $22.60.
Day 3: CVNA hits $22.70, triggering first profit target. Exit 156 shares (50%) at $22.70 for profit of $4.30 per share x 156 shares = $671 locked in.
Day 5: CVNA surges to $26.40 as squeeze extends beyond VB target. Trail remaining 156 shares using 8 EMA (currently at $24.80).
Day 7: CVNA peaks at $28.50 intraday then closes below 8 EMA at $27.10, triggering trailing exit. Exit remaining 156 shares at $27.10 for profit of $8.70 per share x 156 shares = $1,358.
Total trade profit: $671 + $1,358 = $2,029 on 312 shares (average gain of $6.50 per share or 35% return). This two-target approach captured both the VB target move and the squeeze extension.
Real-World Confluence Example
Walk through a complete example using W (Wayfair) on January 13, 2025, showing how all confluence factors align to create a high-probability squeeze trade.
Short Interest Data (from Short Interest Scanner)
- Short %: 26.9% (heavily shorted)
- DTC: 7.8 days (trapped shorts)
- Float: 105M (manageable size for squeeze)
VB Signal Data (from main Scanner)
- Direction: LONG
- Entry: $42.80
- Stop: $39.20
- Target: $48.60
- Conviction: 86 (very high quality)
- Model: Daily Conservative
- Market Pulse: Yellow with FP signal (First Pullback, 3 days old)
- Historical win rate: 62% (above average)
- Expectancy: +$94 per trade (excellent)
Technical Overlays
- RSI: 28 (oversold bounce conditions)
- 8 EMA just crossed above 21 EMA (bullish crossover)
- Candle: Bullish engulfing pattern on January 13
- Volume: 4.8M shares (1.9x average)
- Support: Darvas box low of $41.50 held
8-Point Scoring
- VB Conviction 86 (check)
- Short % 26.9% over 20% (check)
- DTC 7.8 over 5 (check)
- Market Pulse FP (check)
- Win Rate 62% over 60% (check)
- RSI 28 under 35 (check)
- Volume 1.9x over 1.5x (check)
- Darvas support held (check)
Score: 8/8 – Maximum quality setup worth full squeeze position size.
Trade Execution
- Entry: $42.80 for 250 shares risking $500 (assuming $50k account)
- Stop: $39.20
- Target 1: $48.60 (VB target) for 50% of position (125 shares)
- Target 2: Trail with 8 EMA for remaining 50%
Outcome After 7 Days
Day 4: Hit $48.80, exit 125 shares for +$6.00 per share = +$750
Day 7: Trail to $52.40, exit final 125 shares for +$9.60 per share = +$1,200
Total profit: +$1,950 on $500 risk (3.9:1 reward-to-risk ratio or 390% return on risk capital)
The Backtester allows you to verify squeeze strategy performance with historical data before risking real capital on confluence setups.
Common Mistakes to Avoid
- Buying on short interest alone: Without waiting for VB confirmation produces approximately 35% win rate, turning a potential edge into a coin flip with negative expectancy
- Ignoring the VB stop: Rationalizing “it’s so heavily shorted, it has to work eventually” destroys accounts as small losses become catastrophic
- Oversizing squeeze trades: Using normal 2% risk instead of reduced 1% risk amplifies losses when volatility spikes
- Chasing the squeeze: After the stock is already up 40% from lows means you’re late to the party and likely buying near the peak
- Holding past VB target due to greed: Hoping for a bigger squeeze often results in giving back hard-won gains
These mistakes are entirely avoidable through disciplined adherence to the confluence methodology and risk management rules.
Next Steps
Find your first Volatility Box plus Short Interest confluence trade:
- Navigate to the Short Interest tab in the VB platform and sort by Short % with highest values first
- Write down the top 5 symbols with Short % greater than 20% and Days to Cover greater than 5
- Open the main Volatility Scanner and check if any of those 5 symbols currently have LONG signals with conviction 80+
- If any symbols meet both requirements, score the setup using the 8-point checklist
- If the score is 6 or higher, paper trade the setup to learn the mechanics
Paper trade 5 confluence setups before risking real money. Track your win rate and average P&L per trade to verify you understand the methodology. This practice phase is critical because squeeze trades carry elevated risk and require experience to manage properly.
Was this article helpful?
Still need help?
Can't find what you're looking for? Our support team is here to help.
Contact Support