Hourly vs Daily Models
Two models, two trade horizons
Every Volatility Box name carries two models: a Daily model and an Hourly model. Both plot the same way, clouds around price that mark the expected range given current volatility, but they read volatility over different windows. The Daily model gives one level for the entire session; the Hourly model gives a new level every hour. That single difference drives everything else: how often a breach appears, how much weight it carries, and how long you hold the trade.
Watch: Part 4 of the Volatility Box onboarding series.
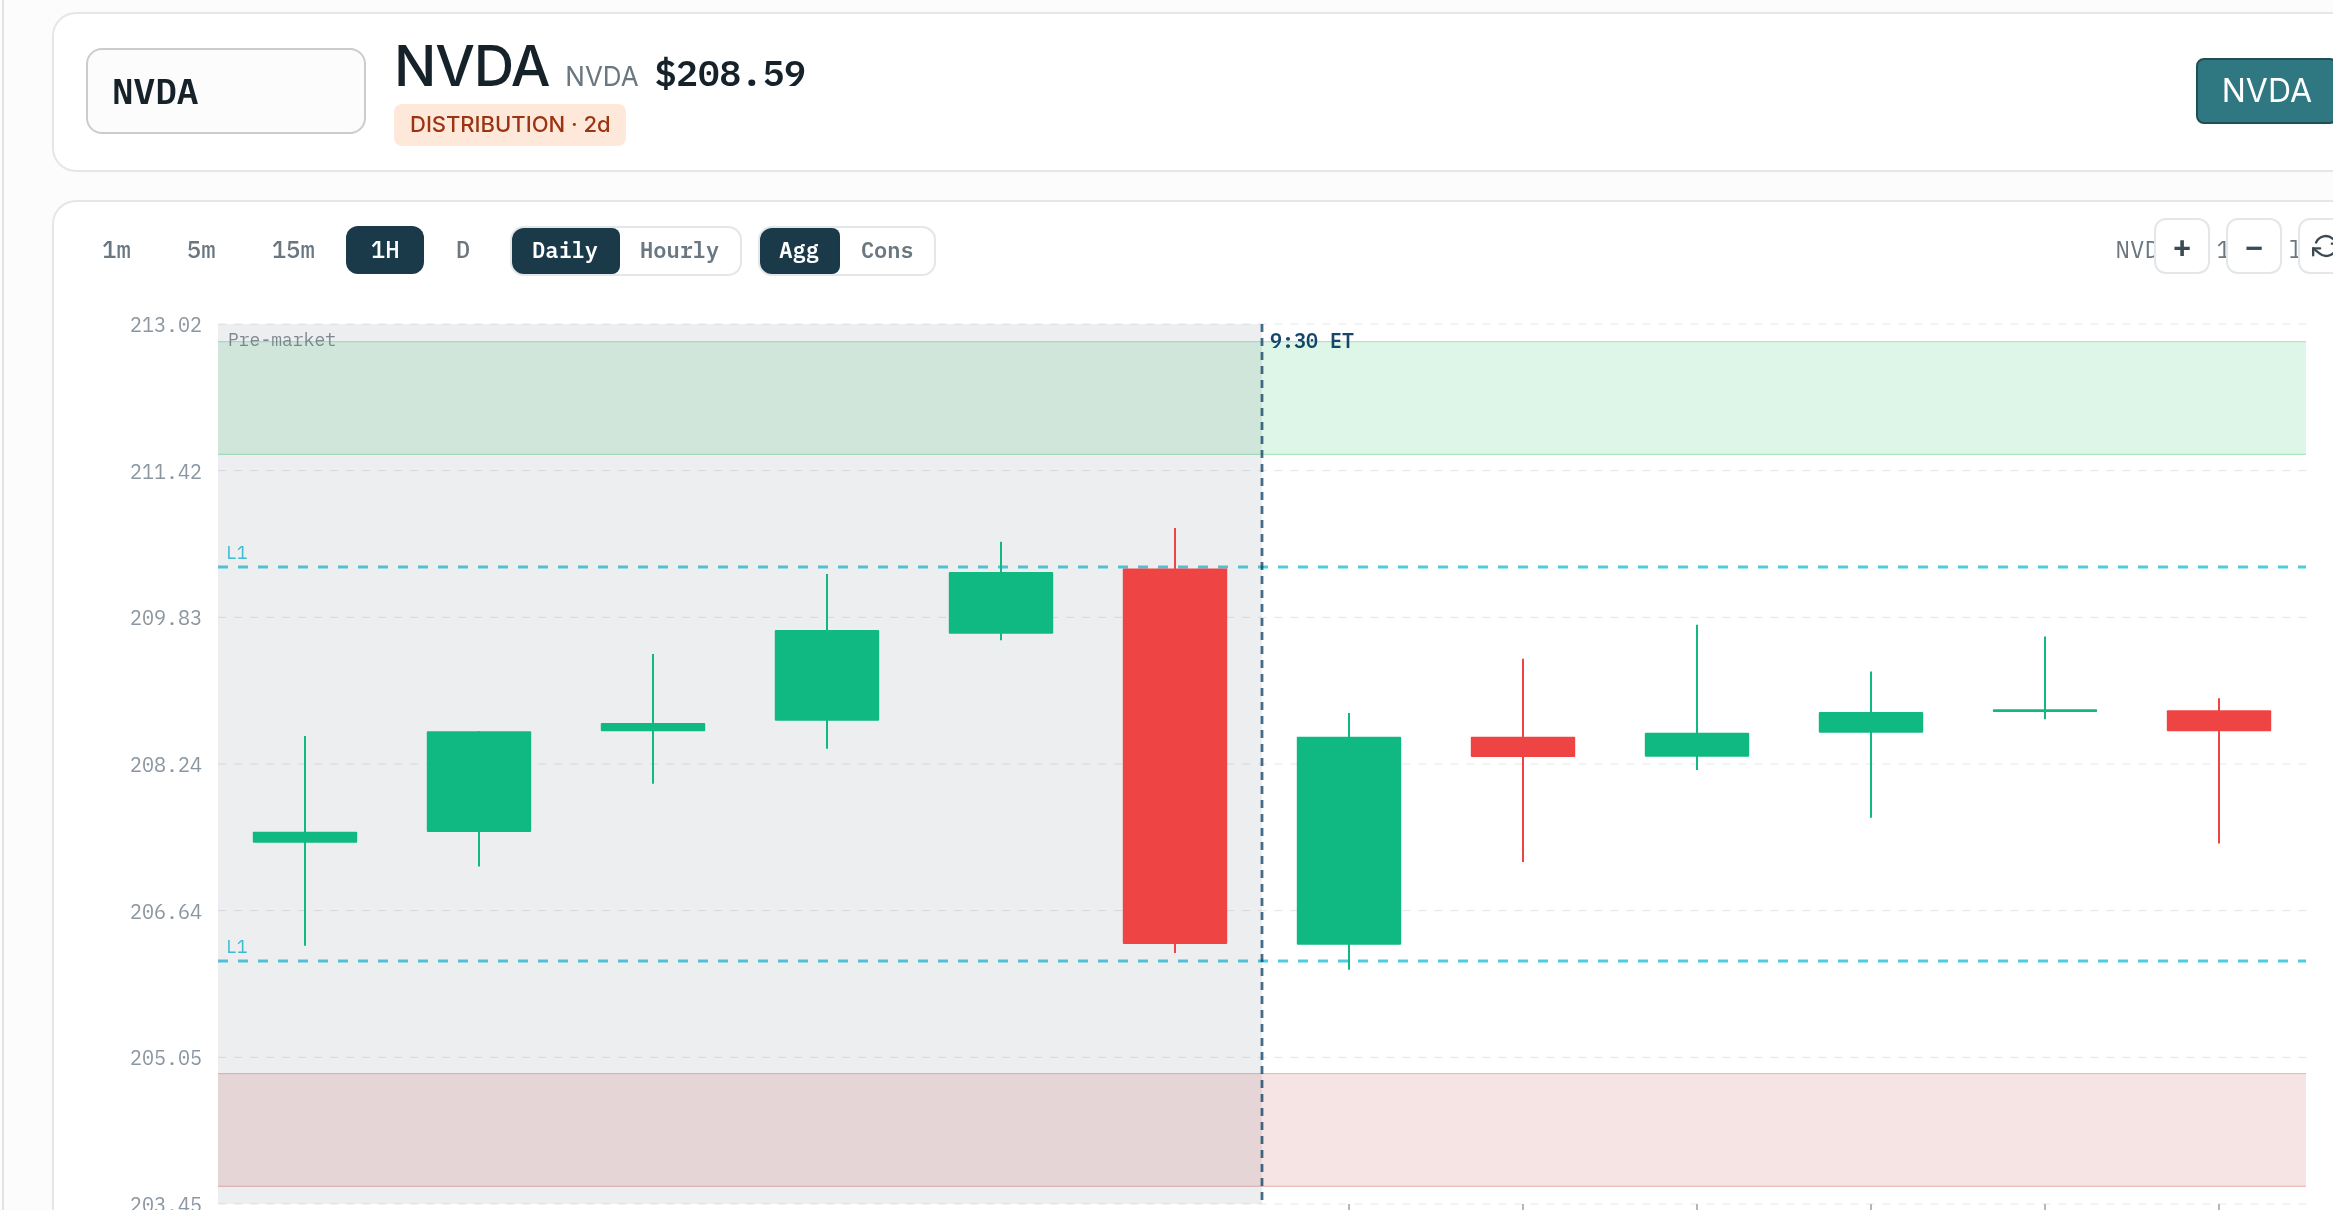
A breach is read the same way on both. Price tags at least the aggressive cloud, the bare-minimum breach, and the conservative cloud sits outside it, so a conservative tag requires breaching aggressive first. The cloud directions hold across both models too: green clouds above price are the short zone, orange clouds below are the long zone, and a long fires when price drops into the lower cloud, not on an upside breakout. What changes between the models is the timeframe the cloud is built from.
Daily models: one level for the day
The Daily model reads daily price bars and sets one upper level and one lower level that hold for the entire session. Because there is only one level and it does not move, it is harder to reach, so a daily breach carries more weight than an hourly one. A daily breach is a swing read, the kind of move that plays out over one to five days rather than within the hour.
Daily models come in aggressive and conservative. Aggressive is the default and where most quiet-day activity sits. Conservative is wider and harder to reach, and because it can only breach after aggressive has, a conservative daily tag is a genuinely deeper push. The conservative daily model carries the most weight in the system, especially on an at-the-edge entry, and it is the model to lean on around earnings and FOMC. A long-side conservative daily breach while Market Pulse reads acceleration is a high-quality entry: a wide, hard-to-reach level lining up with the trend.
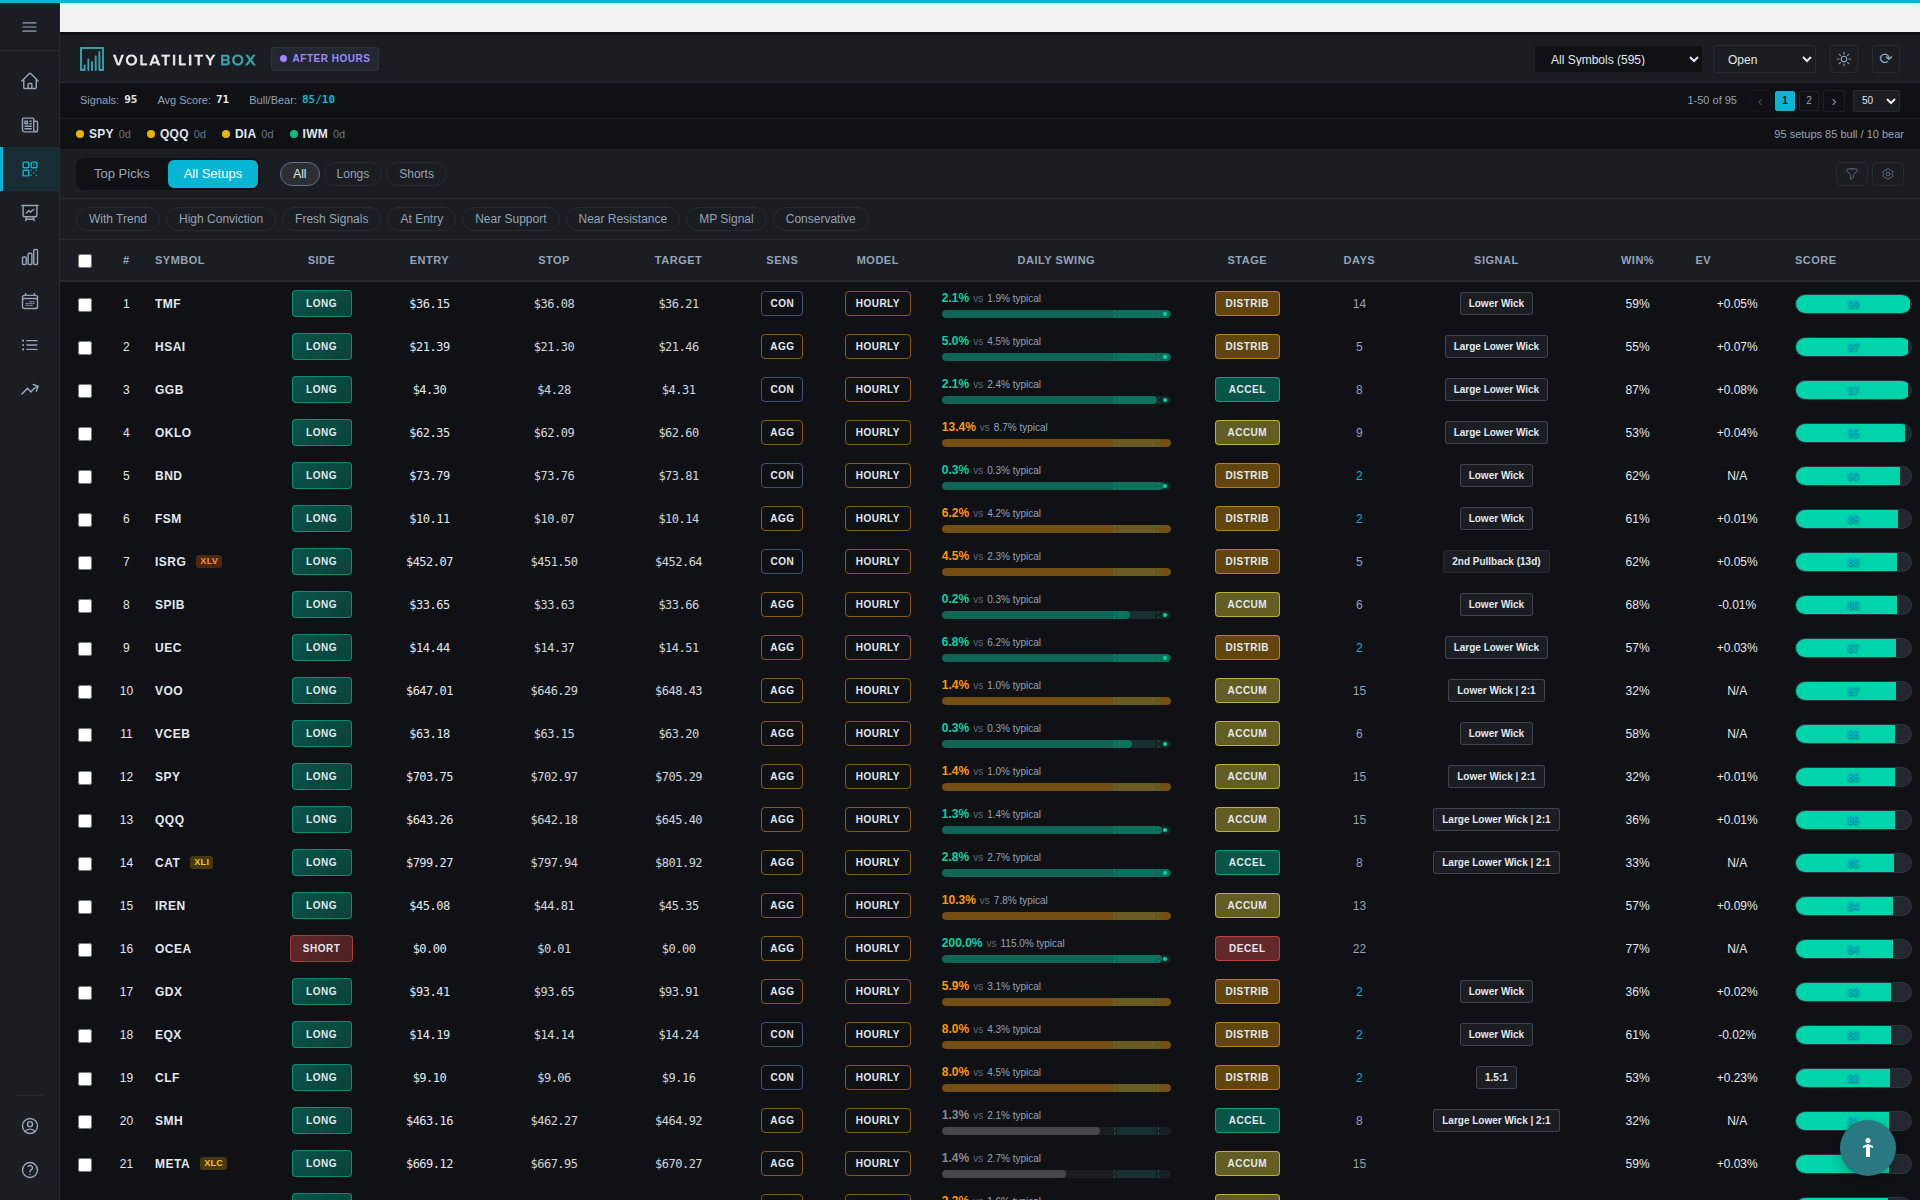
Because daily levels hold all session, a breach at 10:00 is still a valid read at 14:00 if price is still near the level. That makes daily models workable for traders who cannot watch the screen continuously. The Scanner and Backtester both expose Daily as an explicit Model filter, so you can isolate it and see how it behaves on a given name.
Hourly models: a new level every hour
The Hourly model recalculates volatility for each hour and steps to a new level at the top of every hour, reading volatility in real time. Because the level resets hourly, the Hourly model hands you far more breaches through a session than the Daily, which is what makes it useful intraday. If volatility picks up in a later hour, the Hourly model tracks it and flags the edge where the Daily would show nothing.
Hourly models also come in aggressive and conservative, with the same relationship: conservative is wider and breaches only after aggressive. The cost of the extra opportunity is weight. An hourly breach is a smaller, faster read than a daily one, suited to intraday holds rather than multi-day swings.
The tradeoff to respect is that hourly signals go stale fast. A breach of the 10:00 hourly level loses its meaning once the 11:00 level activates, because the volatility calculation has reset for the new hour. Acting on an hourly breach well after it printed means entering against a level that no longer exists. Hourly models suit traders who can act on a breach within minutes of it appearing.
Frequency versus weight
The two models sit at opposite ends of one tradeoff. Tighter, faster levels produce more breaches, each carrying less weight; wider, slower levels produce fewer breaches, each carrying more. Hourly aggressive fires the most and weighs the least. Daily conservative fires the least and weighs the most. Daily aggressive and hourly conservative sit in between.
This is a frequency-versus-weight tradeoff, not a quality-of-trade promise. The Volatility Box approach wins on expectancy, letting winners run larger than losers, rather than on a high hit rate, so even the weightier daily setups resolve against you a fair share of the time. The point of choosing a model is matching the breach rate and hold time to how you trade, not chasing a model that is right more often.
Reading the breach split on the dashboard
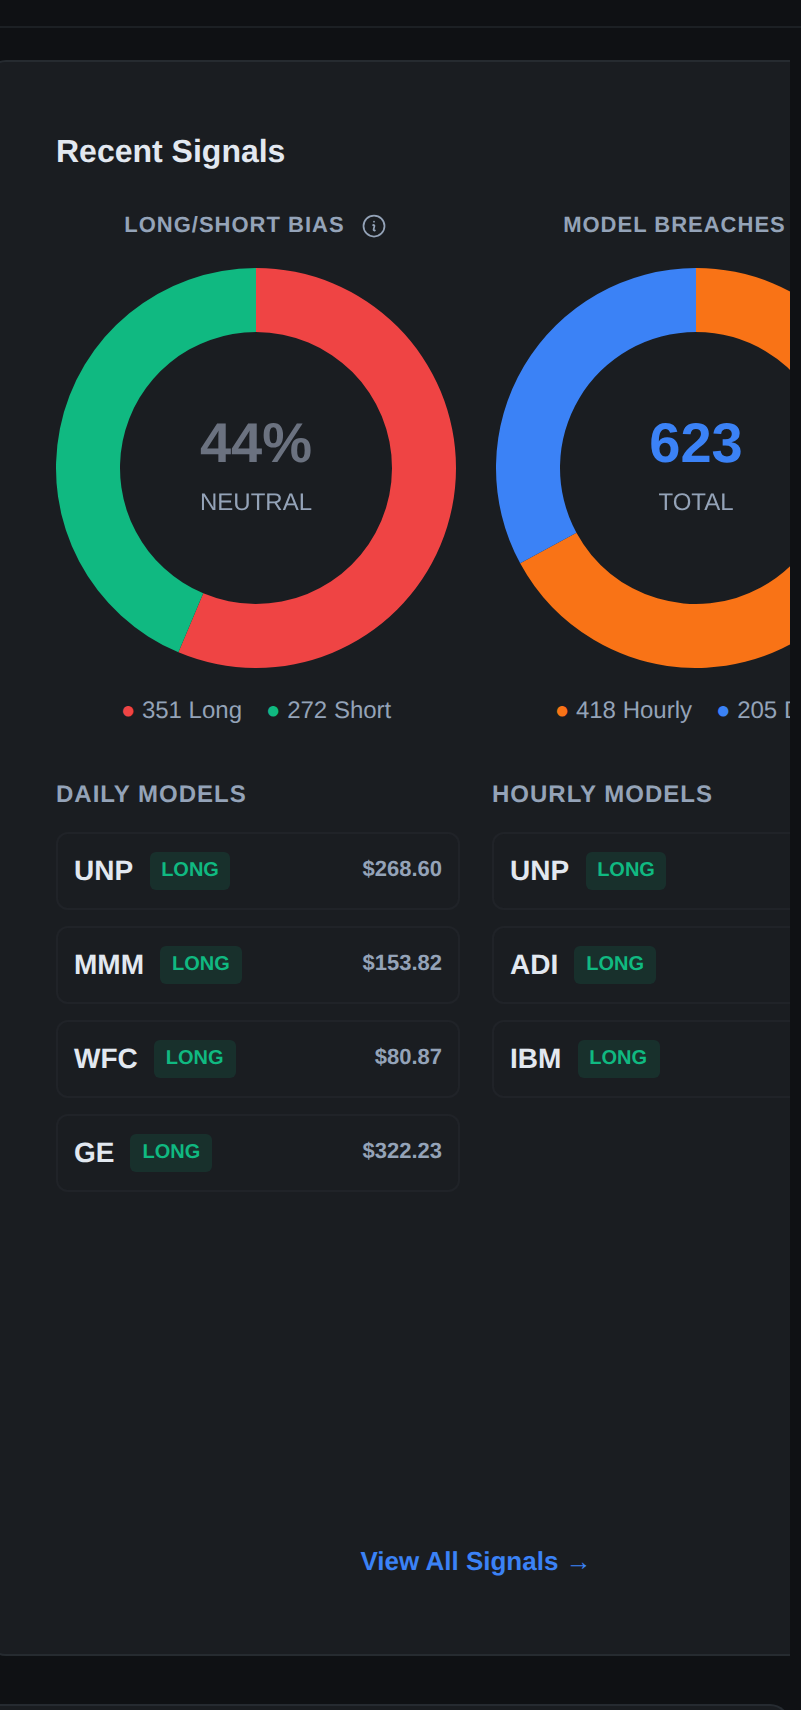
The dashboard splits the day’s breaches between Daily and Hourly. On most days hourly breaches dominate, because the hourly level is tighter and resets every hour. When daily breaches climb to an unusually large share, names are stretching beyond their normal daily ranges, which points to a strong trending or high-volatility tape where the swing reads are worth more attention. When daily breaches stay scarce and hourly breaches carry the day, the tape is normal intraday movement without significant daily-timeframe moves, conditions that favor intraday work over swings.
Matching the model to how you trade
Pick the model that fits the time you can give the screen and the holding period you want. If you can watch markets through the session and act quickly, the hourly models give you a steady stream of intraday reads, and the first hour is a useful tell: the open often drives straight into the hourly clouds on a name like Microsoft or Nvidia even when the broad indices stay quiet, flagging what is in play. If you can only check in a few times a day, the daily models, and the conservative daily in particular, are the realistic choice, because the level holds long enough for you to act on it without the entry decaying in the meantime.
The common mistake is mismatching the two: day-trading a daily breach or trying to swing-trade an hourly one. A daily breach taken at 10:00 may chop sideways for two hours before the multi-day move develops, so trading it on an intraday clock means exiting at breakeven out of boredom right before it works. An hourly breach held for days means holding a read whose level reset hours ago. Match the hold to the model that produced the signal.
Stops scale with the model
Daily models carry wider stops than hourly models, because the cloud is built to absorb a full day’s volatility rather than a single hour’s. In both cases the stop is sized to the cloud rather than set at a fixed dollar amount, which is what keeps normal noise from chopping it out. The practical consequence is position size: a wider daily stop means fewer shares for the same dollar risk, while a tighter hourly stop allows more shares for that same risk. The daily trade therefore tends to move more points on fewer shares, and the hourly trade fewer points on more shares. Size to the stop the model gives you rather than to a fixed share count, or a wide daily stop on a normal-size position will put far more at risk than intended.
Using both together
The models are not mutually exclusive. A common approach uses the daily breach to set direction and the hourly breach to refine the entry within it. If a name breaches its daily lower (orange) cloud, a long-side read, you can drop to its hourly chart and wait for an hourly breach in the same direction to time a tighter entry inside that larger daily setup. You are confirming a multi-day volatility edge on the daily, then using the hourly level to improve the entry price without fighting the daily read.
Related
Was this article helpful?
Still need help?
Can't find what you're looking for? Our support team is here to help.
Contact Support