Multi-Factor Confluence
Confluence is what turns a breach into a setup worth trading. On its own, a Volatility Box breach just tells you price is at the edge with a volatility edge. Confluence is the evidence you stack on top of that breach to separate a tempting breach from a real, high-probability setup. This is the canonical four-layer framework, and it is baked directly into the setups.
Watch: Part 5 of the Volatility Box onboarding series.
Start With the Breach, Then Layer
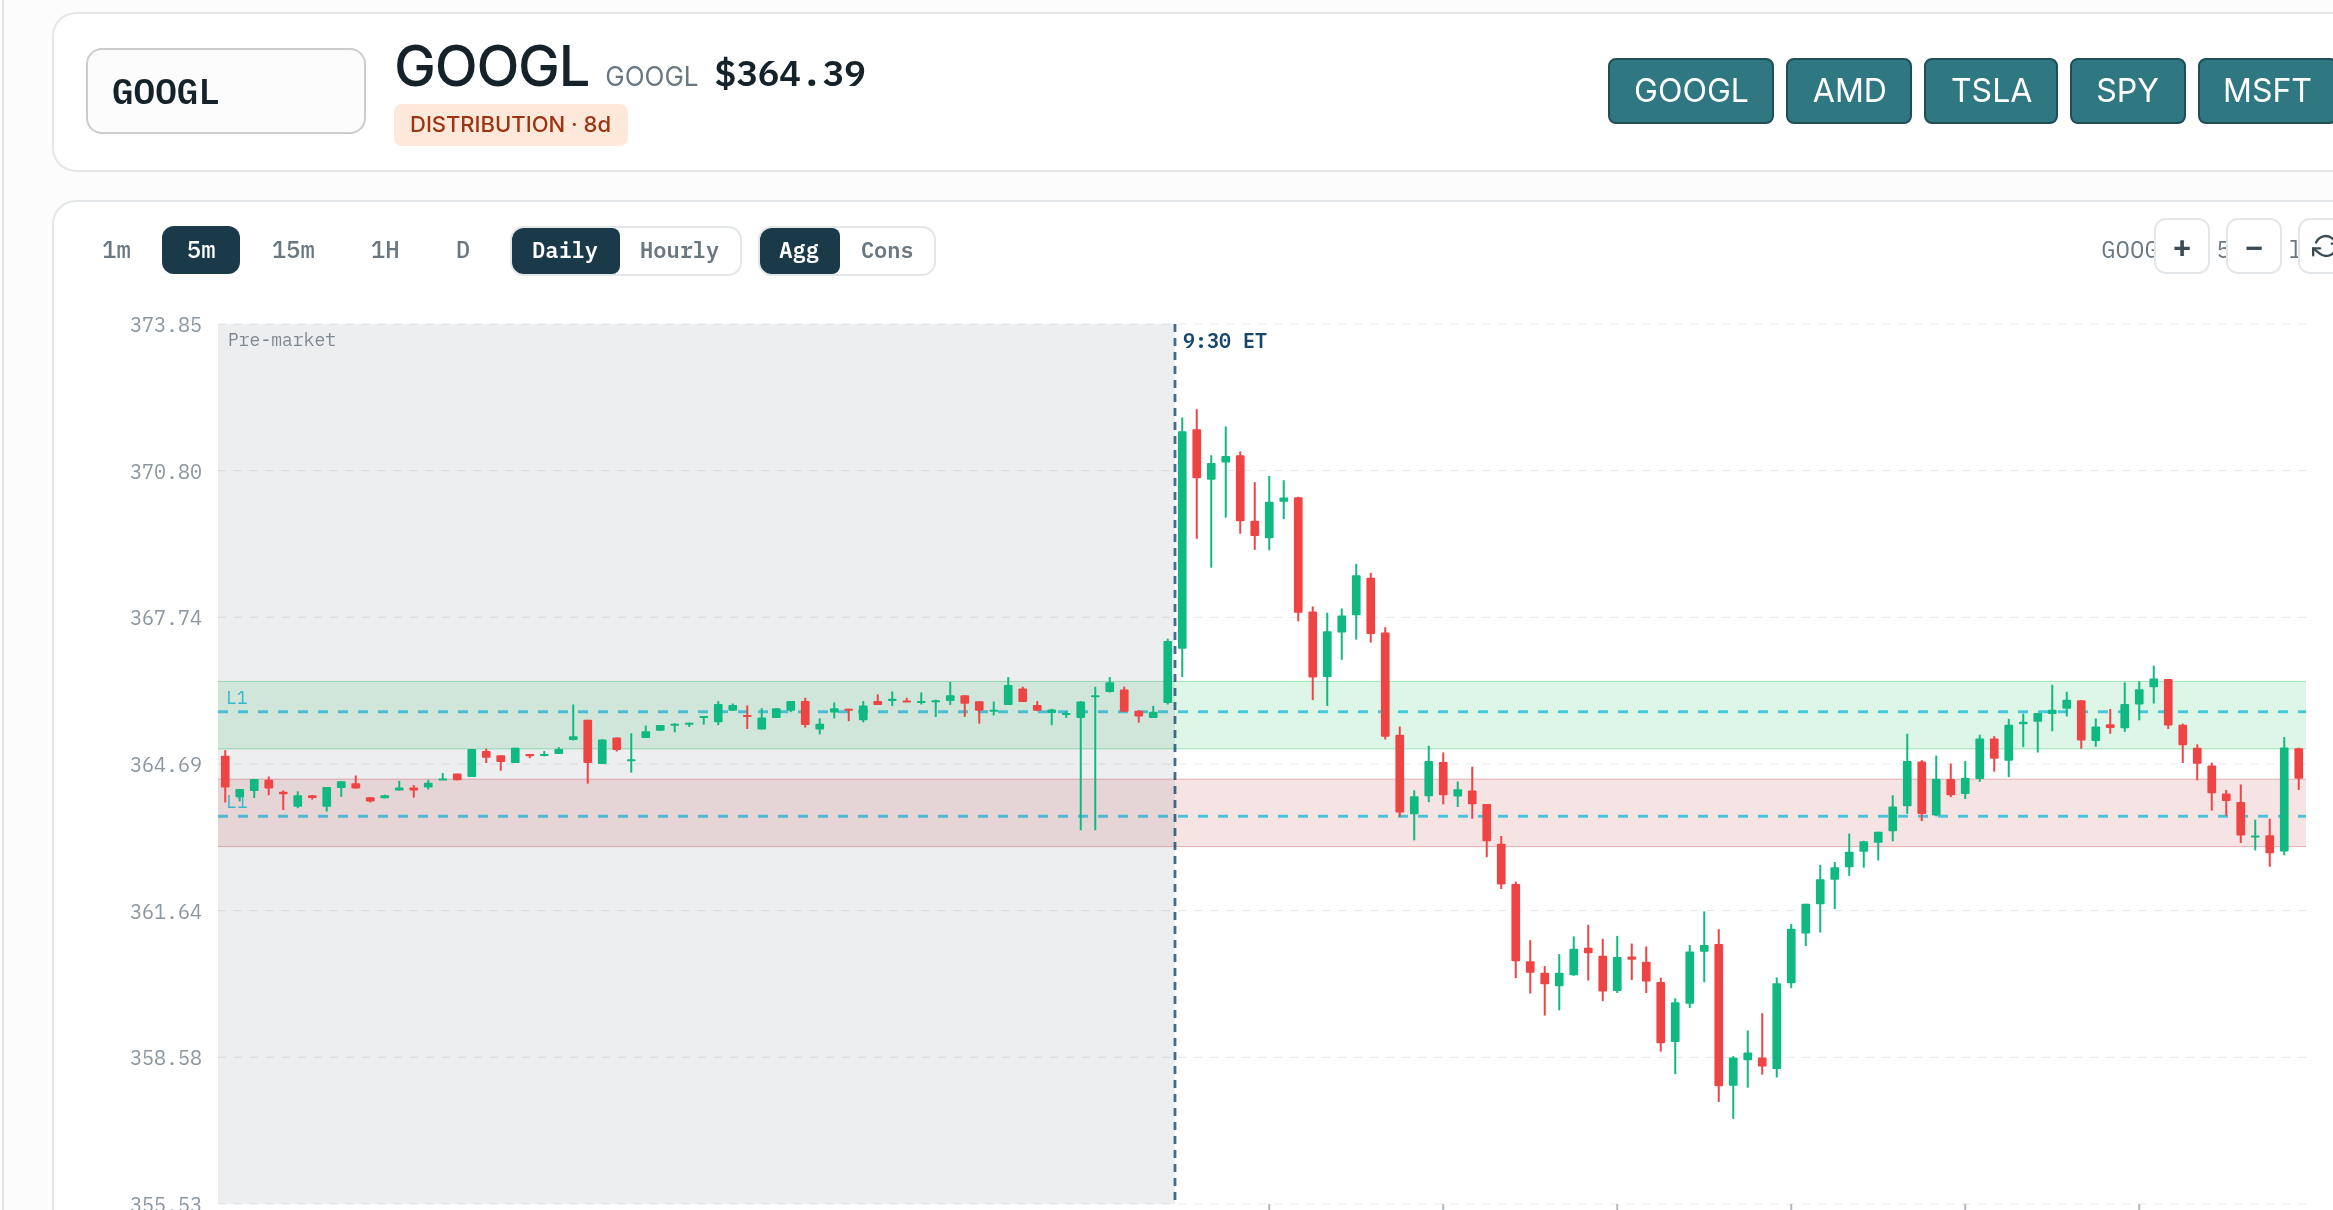
The Volatility Box is the crux of everything. It is built on volatility models created in 2018 by quant traders and engineers, and it gives an instant framework for price and volatility. When price tags at least the aggressive cloud, you have a breach, and a breach is your clue that you have a volatility edge. (Remember the directions: the green clouds sit above price and frame short entries, the orange clouds sit below price and frame long entries, so a long fires when price drops into the lower orange cloud, not on an upside breakout.)
But the breach is just a starting point. What separates a tempting breach from a setup you actually want to trade is what you layer on top of it. There are four things to stack. The first two are the core of every setup; the last two are optional, but they add a real edge if you are comfortable adding a couple more indicators to your chart.
Layer 1: Trend (Market Pulse)
The first question on any breach is simple: is the trade with the trend or against it? The trend comes from the bigger picture, the daily timeframe, and that read is baked into the Scanner and the platform.
Market Pulse answers “what is the trend?” because it leaves no room for subjectivity. It groups the trend into one of four market stages, so you get clean, ready-to-use information instead of a judgment call. The long-leaning stages are Accumulation and Acceleration; the short-leaning stages are Distribution and Deceleration.
A breach where you are trading with the trend, say buying a long-side breach (price dropping into the lower orange cloud) inside a strong uptrend, is a much higher-probability play than buying that same pullback inside a downtrend. The second case is a counter-trend trade. They do work, and you will find days where they pay, but they are the lower-probability path.
There is one counter-trend clue worth knowing, and it is a little counterintuitive: the farther price is from the Market Pulse line, the higher the likelihood of a sharp reversal. If you are going to fade a move, you want price as far extended as possible, already stretched enough that the market is looking for an excuse to revert to the mean.
Layer 2: Edge Signal (Overbought / Oversold)
The second layer tells you that you are officially in overbought or oversold territory. A Volatility Box membership includes the Edge Signal indicator, a custom overbought/oversold tool built on several components including a dynamic RSI and a few proprietary momentum indicators.
In plain terms, it is the green or red arrow that confirms the move is exhausting and actually starting to reverse instead of just continuing to run. Green arrow for longs, red arrow for shorts. This is the anti-noise layer: one validated volatility signal instead of twenty conflicting indicators. To trade a blind breach, the simplest recipe is to wait for price to hit the models, look for an Edge Signal arrow confirming the direction, and use your favorite timeframe for the entry.
Layer 3: Keltner 3.0 Channel Wedges (Optional)
Layers three and four are optional, but they help. The third is the Keltner channel wedges. The signal is price closing outside the 3.0 Keltner channels, which is a natural reason to expect a reversion to the mean. It supports what volatility is already saying through the breach, but now, on top of the volatility edge, there is a price edge too.
Layer 4: 3/8 EMA Momentum Cross (Optional)
The fourth layer is the momentum cross: simply the 3 EMA crossing the 8 EMA. It is a very simple indicator, but it is an easy-to-read clue that momentum is kicking in. When you are looking for the direction to flip, the momentum cross is the final tick on the V-shaped reversal, the confirmation that the turn is underway rather than just a pause.
Putting the Layers Together
Here is the full stack on a long-side breach. Price drifts down and tags at least the aggressive lower (orange) cloud, that is your breach and your volatility edge. Then you confirm: Market Pulse says the trend supports a long (Layer 1), the Edge Signal prints a green arrow (Layer 2), price has closed back outside the 3.0 Keltner channel (Layer 3), and the 3 EMA crosses up through the 8 EMA (Layer 4). The more layers that align, the higher the probability, and the more comfortable you should be sizing the trade. Shorts are the mirror image at the upper (green) cloud.
You do not need all four every time. Layers 1 and 2 are the core; pick and choose 3 and 4 based on your trading style and where you like to take an entry. The point is to let the data decide rather than your willpower, which is exactly what keeps you out of FOMO entries, revenge trades, and held losers.
The Two Breaches the Layers Sit On
Confluence layers on top of one of two breach types, and it is worth being precise about which one you are trading:
- Blind breach: price hits the inner / top edge of the clouds, stays inside the clouds, and bounces. This is the traditional, classic breach, the clean, easy-to-read volatility edge, and the core first setup. To trade it, combine it with an Edge Signal arrow in the trade’s direction.
- At-the-edge breach: price pushes to the outer edge of the clouds, a deeper pullback. Because price has stretched further, you can place your stop outside the clouds, which gives the trade more operating room and a shot at a bigger reward. The at-the-edge breach paired with the conservative models is about as conservative as the system gets. If price keeps going beyond the conservative at-the-edge level, there is no wider model left to absorb it, which tells you volatility is simply too high in that market and it is best to sit out.
Why This Beats Single-Factor Trading
A breach by itself is little better than a coin flip; volatility being high does not tell you which way price resolves. Stacking trend, the Edge Signal, the Keltner wedges, and the momentum cross is how you turn that raw volatility edge into a high-probability, repeatable setup. And it lets you size with conviction: more layers aligned justifies a larger position, while a lonely breach with nothing confirming it is one you let go.
One honest caveat: confluence raises your odds, it does not guarantee a win. You can stack all four layers and still lose the trade, the same way you can win 60% and still have losing streaks. The edge lives in expectancy, taking quality setups consistently and letting winners outrun losers, not in any single trade. Volatility-sized stops, placed off the clouds rather than at a fixed dollar amount, are what keep normal noise from chopping you out before the setup has a chance to work.
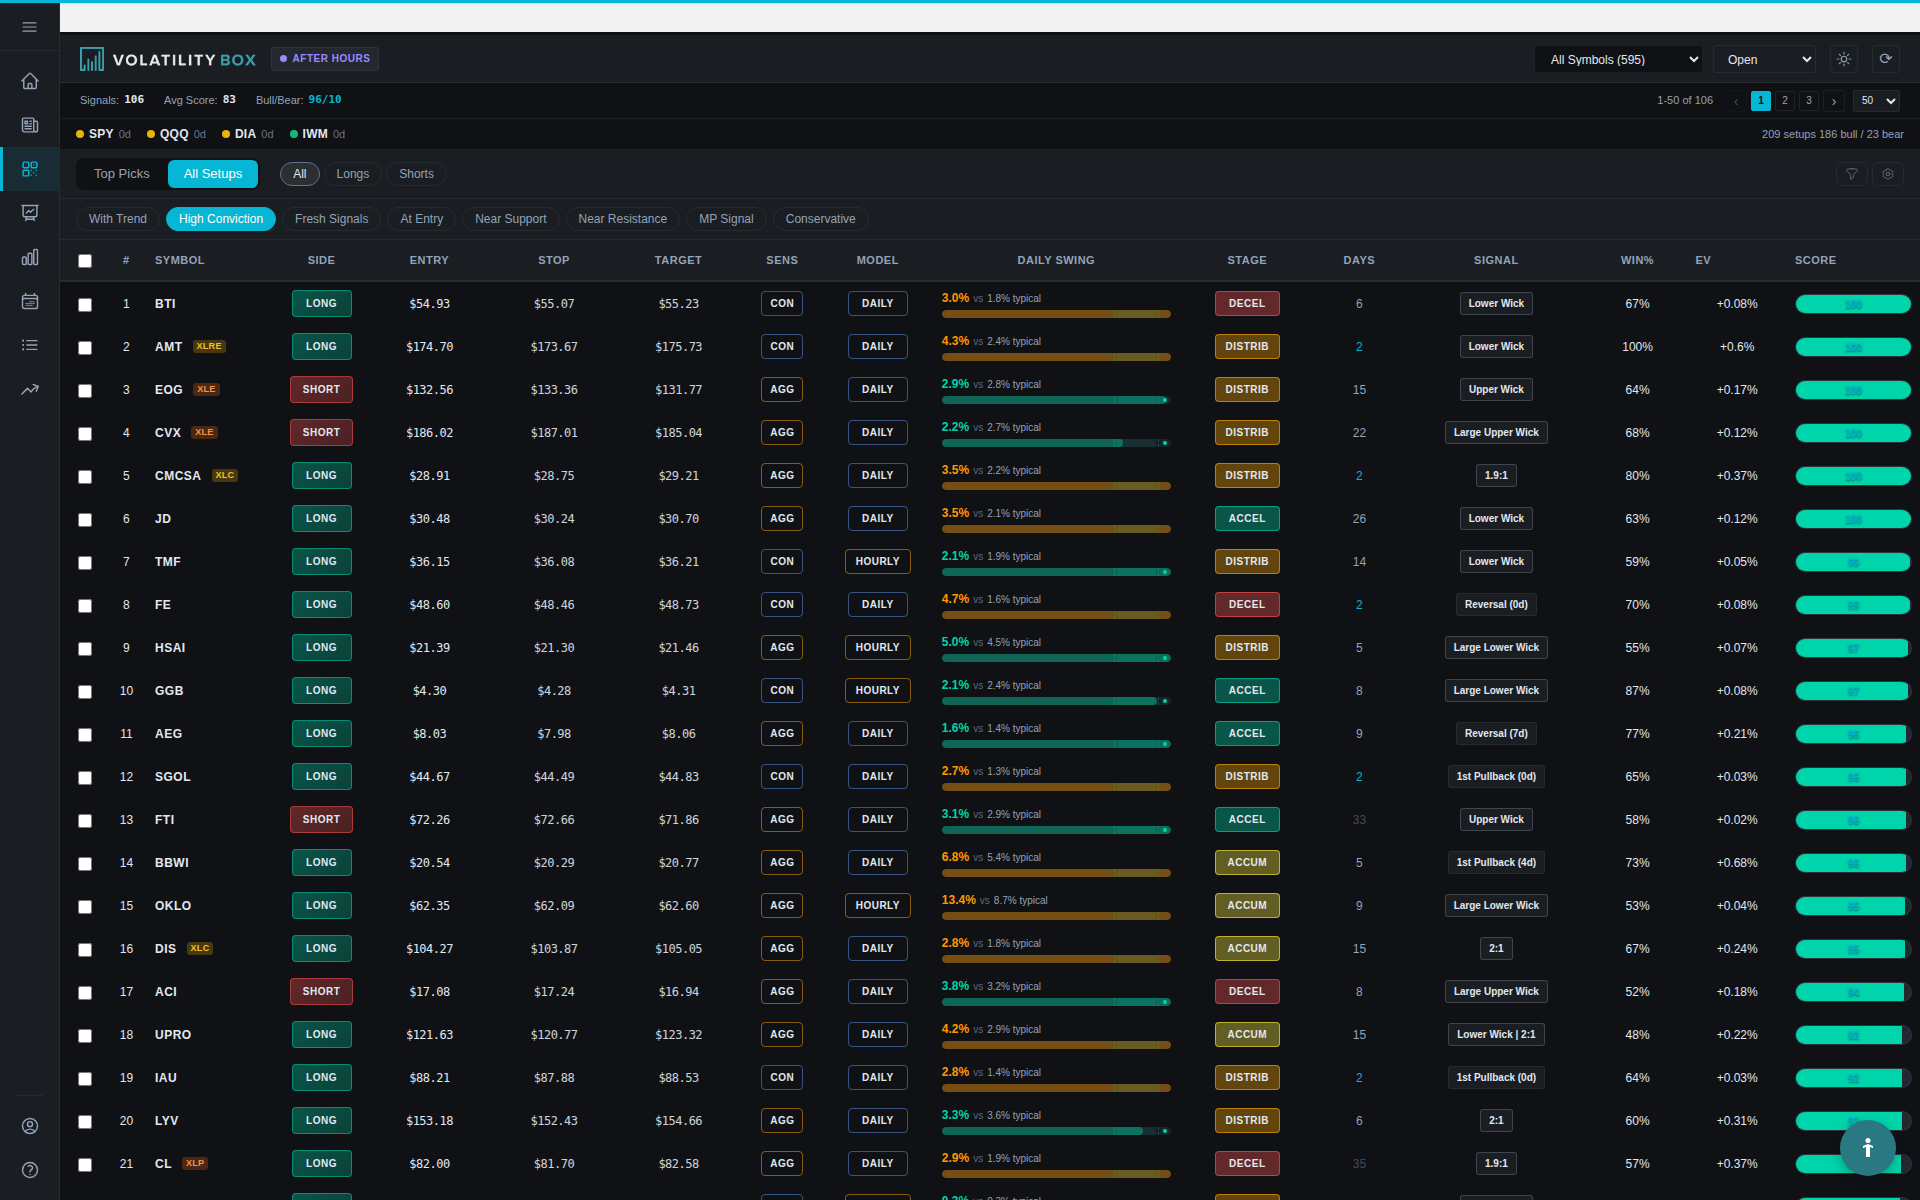
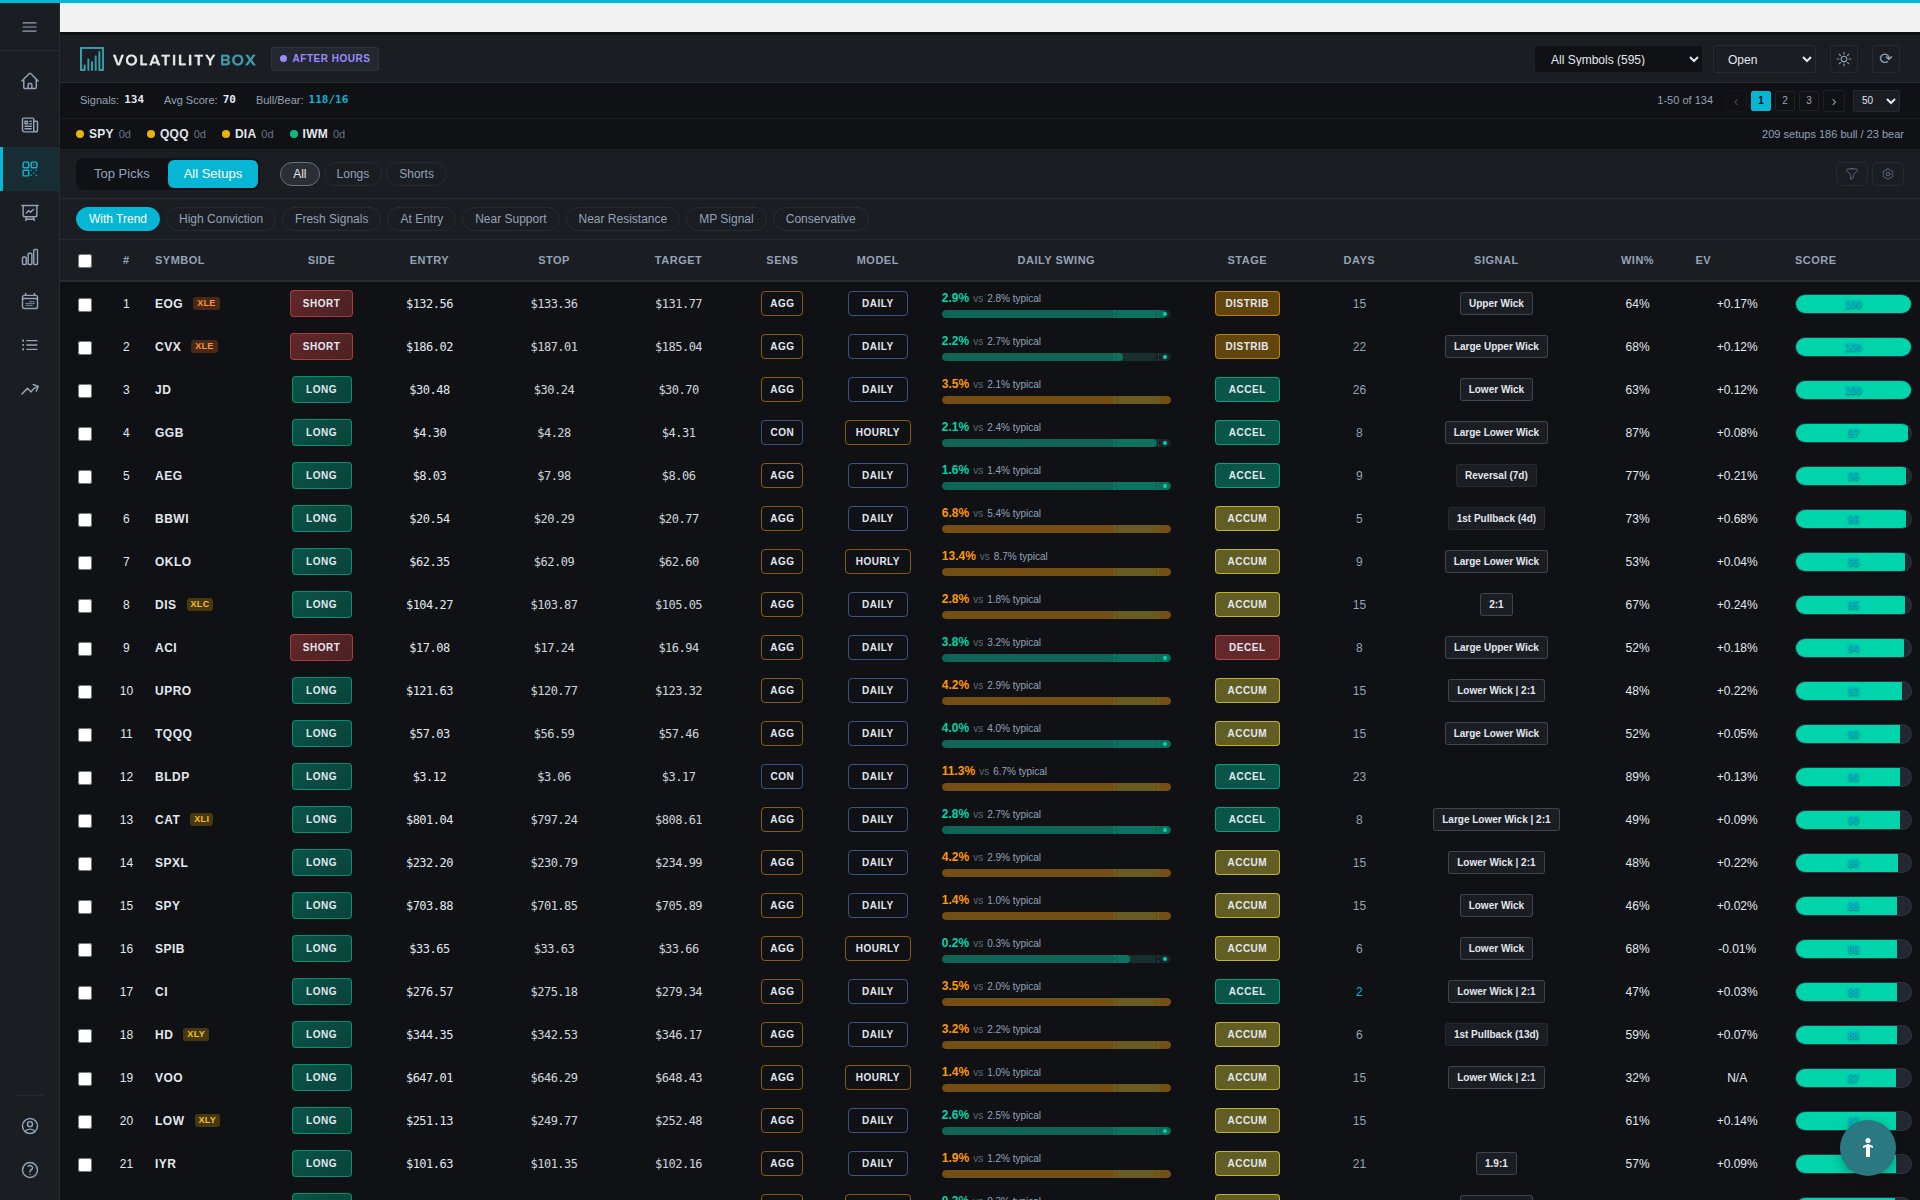
Where This Is Done for You
Most of this stacking is already handled inside the Scanner, so you do not have to assemble all four layers by hand on every name. The Scanner filters surface breaches where the trend, the Edge Signal, and the supporting indicators already line up, and the Symbol Page charts let you eyeball the Keltner wedges and the momentum cross before you commit. Use the framework manually inside thinkorswim with the indicator set when you want full control, or lean on the Scanner to pull these setups for you every day.
Related
Was this article helpful?
Still need help?
Can't find what you're looking for? Our support team is here to help.
Contact Support