Market condition adaptations
The models stay the same as conditions change; what you adjust is which ones you lean on. Aggressive versus conservative and daily versus hourly are the two levers, and the state of the clouds tells you when to sit out entirely. This covers how to shift those levers as the regime moves from calm to volatile.
Aggressive versus conservative
The aggressive models are where you spend most of your time on quiet days. They are easier to reach, so they hand you more breaches when volatility is normal. The conservative models are wider and harder to reach.
Lean on the conservative models when volatility rises: earnings days, the run into FOMC, and names that are naturally volatile. When the rest of the market is breaching mostly aggressive levels but a handful of names are reaching their conservative levels, those names are worth extra attention, especially when they breach in the direction of the trend. A conservative breach in a trending name is a wider, harder-earned level, which is why it carries more weight.
The backtester is how you confirm which to use on a given name. Running a symbol on the aggressive models and then the conservative models often shows the edge sitting between the two: the aggressive breach is the first alert, and the entry waits closer to the conservative level. Other names perform better on the aggressive models, where a break toward the conservative is the cue to step out.
Daily versus hourly
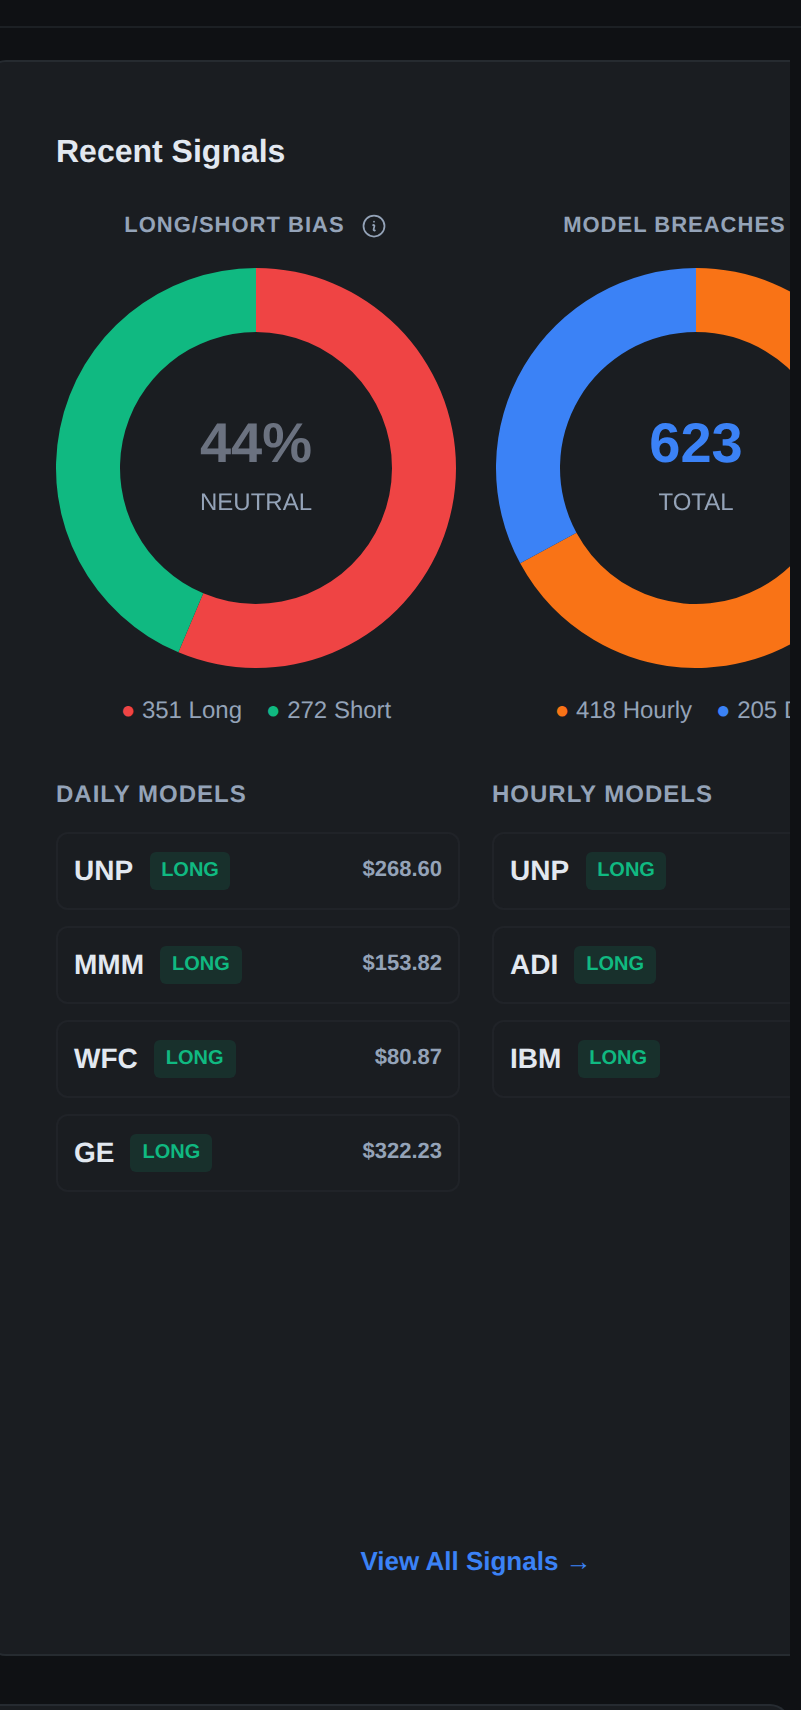
The daily models give one level for the whole day, which makes them harder to hit and weightier when they are. The hourly models give a new level every hour and hand you more breaches through the session. As markets get faster, narrowing toward the daily models filters out the intraday noise; on calmer trending days the hourly models give you more to work with. The backtester again tells you which a name respects: a strong daily curve and a mediocre hourly one marks a daily name, and the reverse points to the hourly models.
Reading the cloud state
The third read is the state of the clouds themselves. On most days price fluctuates between the clouds and the models are respected. On volatile days the clouds compress, pull in tight, and can invert. An inversion is a clear sign this is not a quiet day: volatility is high enough that the expected range has blown out past twice the normal range. When the clouds compress or invert, either sit out or trade only in the direction of the pressure. If the bulls are running straight over the shorts where you would normally expect selling, that is the inversion telling you not to fade it.
Aligning with the regime
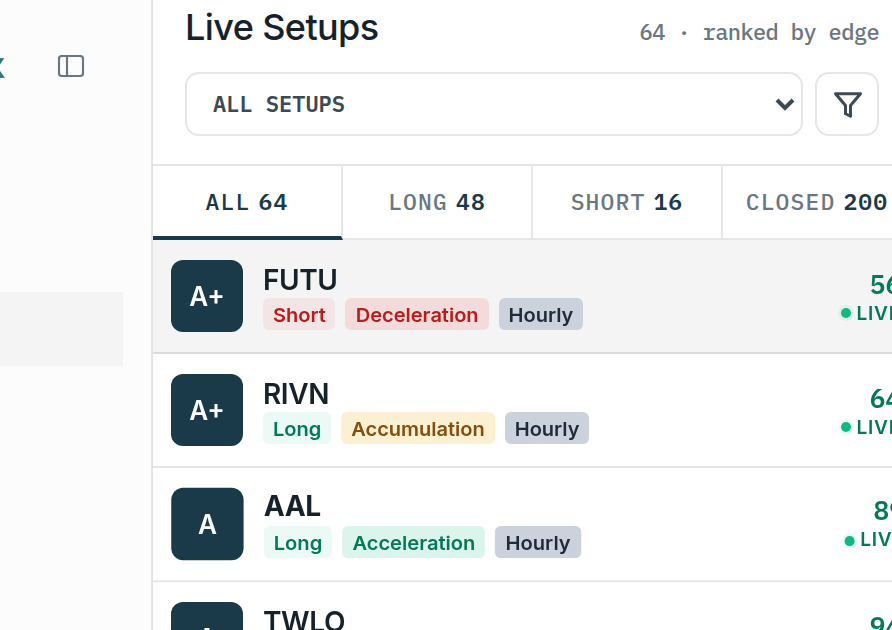
Use the Scanner filters to apply the day’s condition to the list. Set direction to the day’s lean so the other side stays off the screen. Narrow the model and sensitivity toward daily and conservative when the market is moving, or leave it wider on quiet days. Filter by Market Pulse stage to focus on the names in fresh trends: with the broader market in acceleration, the stocks in the acceleration phase are where a new move can be ridden. The stages are accumulation and acceleration for a long lean, distribution and deceleration for a short lean.
The through-line is that high volatility pushes you toward the conservative models, the daily timeframe, and a smaller set of names, while compression and inversion push you to sit out. None of that changes the models. It changes which of them you trust on the day in front of you.
Related
Was this article helpful?
Still need help?
Can't find what you're looking for? Our support team is here to help.
Contact Support