Platform Navigation Guide
A reference to the left-hand navigation: the four core pages you move through in order, then the supporting tools below them. Each entry lists what the page is, what it shows, and when to use it.
Watch: Part 1 of the Volatility Box onboarding series.
Core pages
| Page | What it is | When to use it |
|---|---|---|
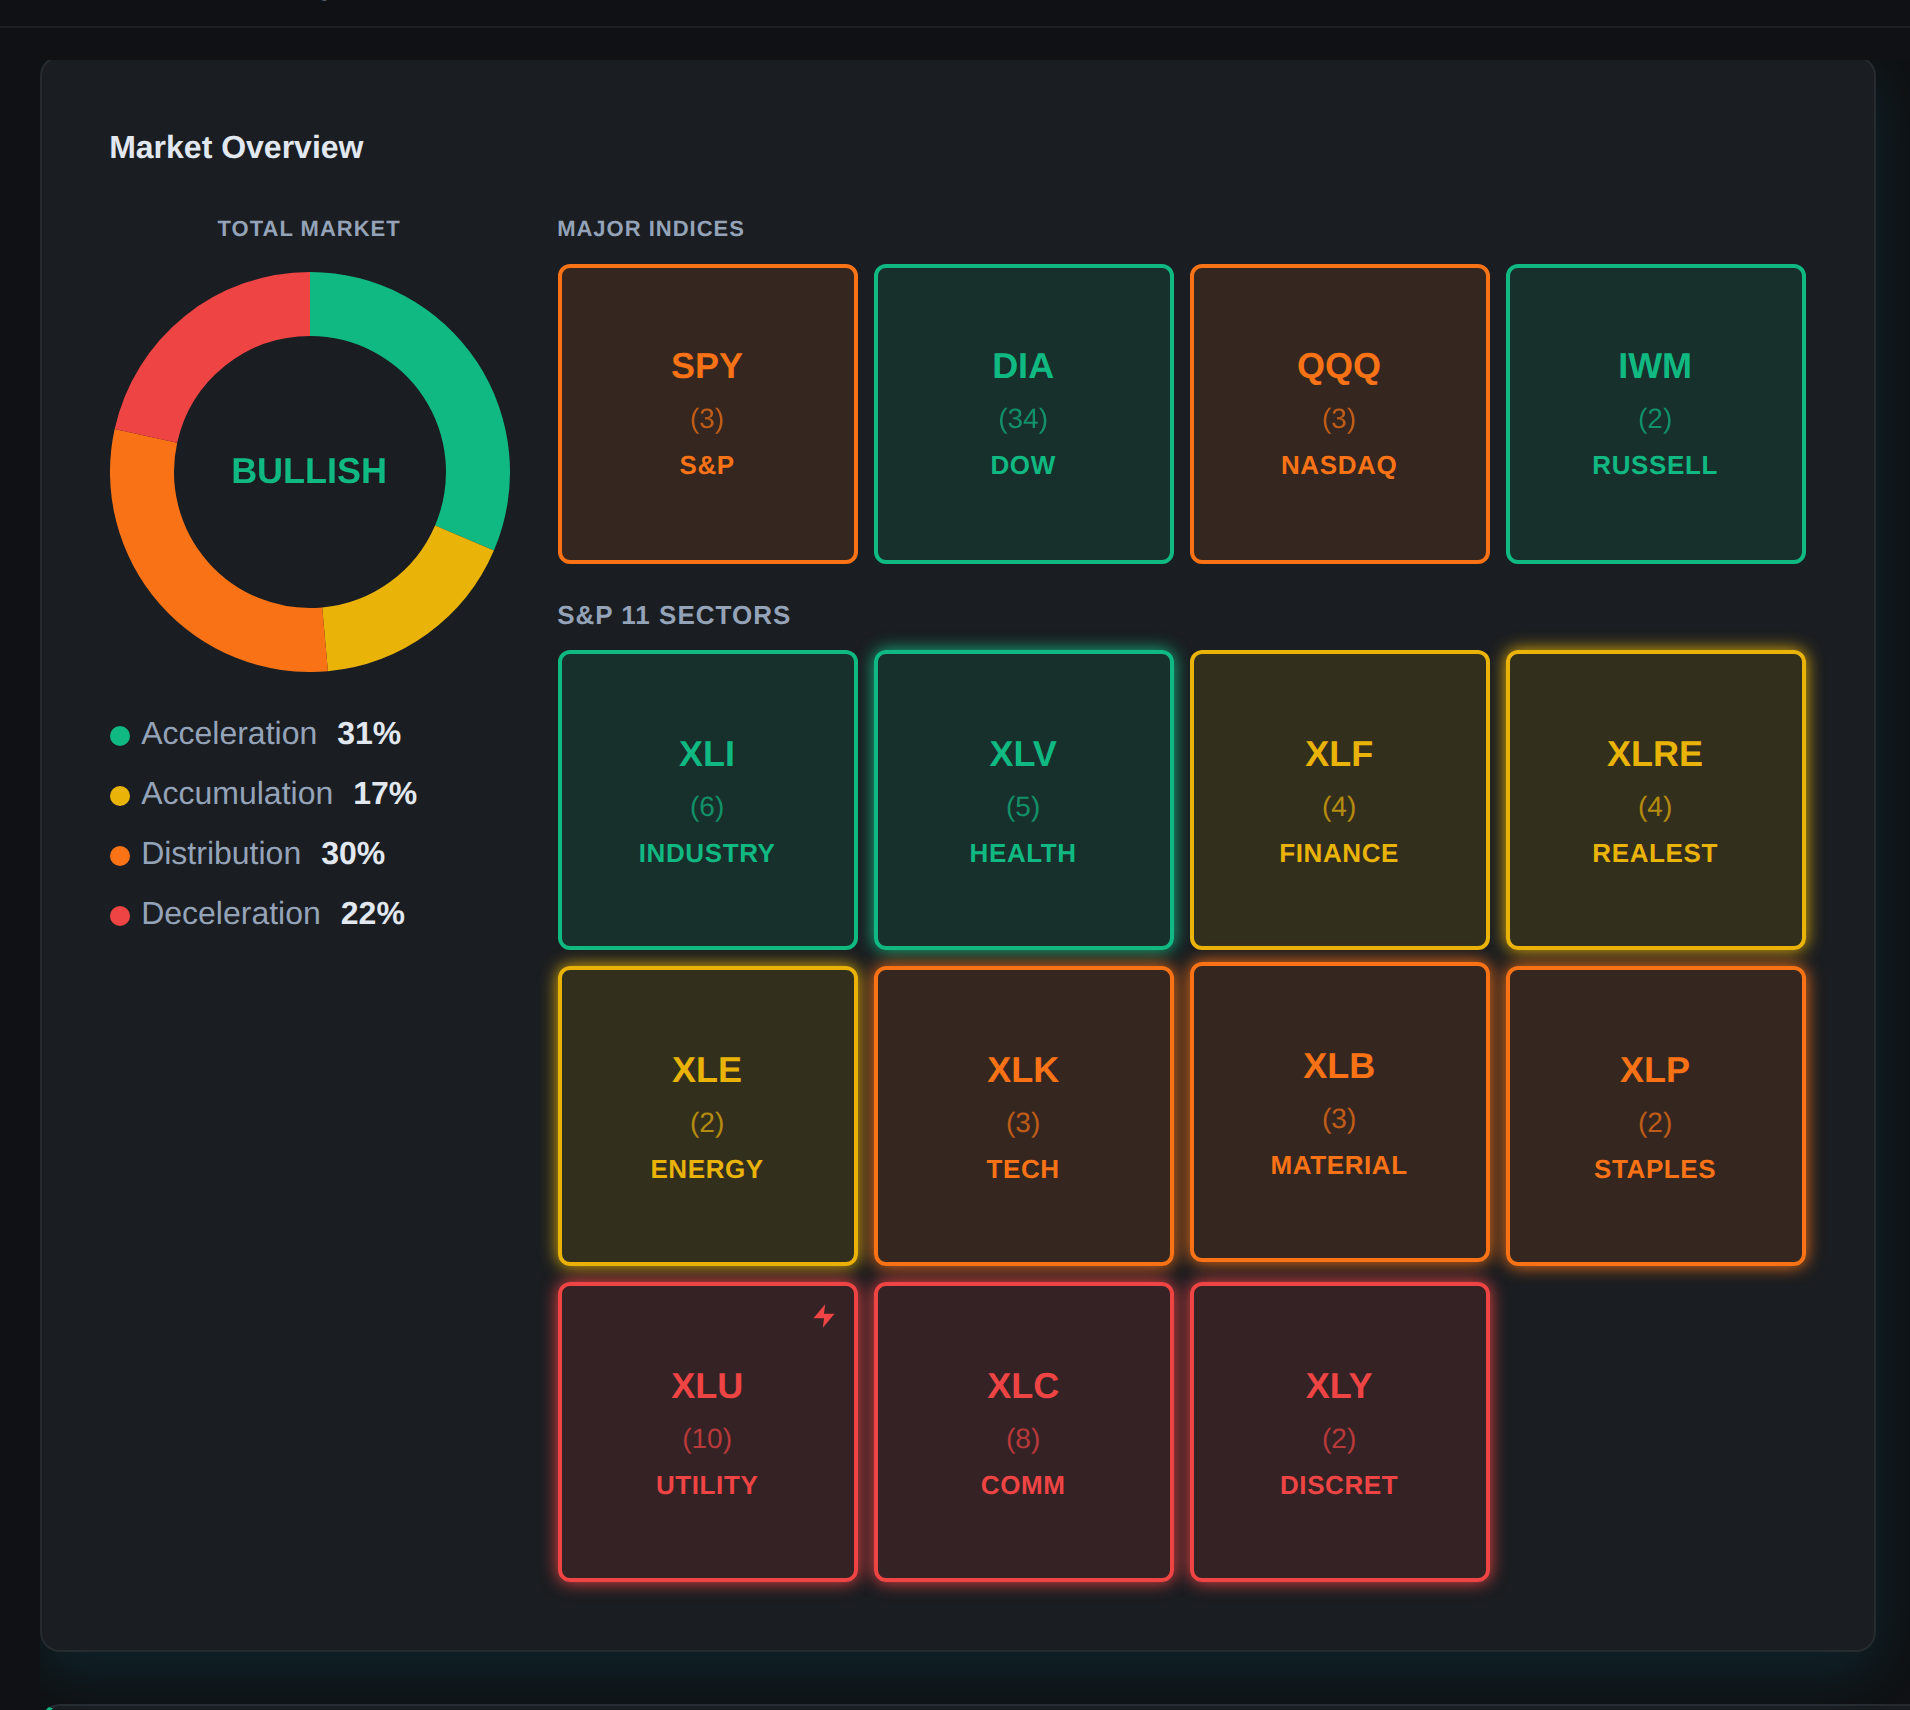
| Today | The model’s read on the entire market: snapshot, breadth, range, leading sector, the four index markets by stage, sector rotation, where-to-focus buckets, and the top-setups shortlist. | First thing each morning, to set bias and direction. |
| Scanner | The live, graded list of names where the models say you have an edge right now, with the right panel showing the chart and trade levels for the selected name. | Through the day, to find fresh setups and monitor open ones. |
| Charts | The model’s expected range, the clouds and levels, on any symbol, across timeframes. | To confirm a setup visually before entering. |
| Backtester | How the models have performed on a name, going back several years. | Before trading a name you do not know, or to confirm an edge has held. |
Tools
| Tool | What it is | When to use it |
|---|---|---|
| Watchlists | Symbol lists for the names you trade. Starter lists (such as ETFs only and S&P 100) ship with the platform; you can create your own and filter the Scanner and Today page down to them. | Build your core list once, then revisit as your names change. |
| Short Interest | Scans for names with high short interest alongside their Volatility Box setups. | When factoring short interest into a reversal setup. |
| Indicator Generator | Builds thinkorswim study files: the weekly bundle of about 115 symbols, plus custom generation by ticker or watchlist. | Each week for the fresh bundle, or when you add a symbol. |
| Alerts | Telegram notifications on a fresh breach, connected by scanning a QR code. | Set once so breaches in your names come to your phone. |
Scanner reference
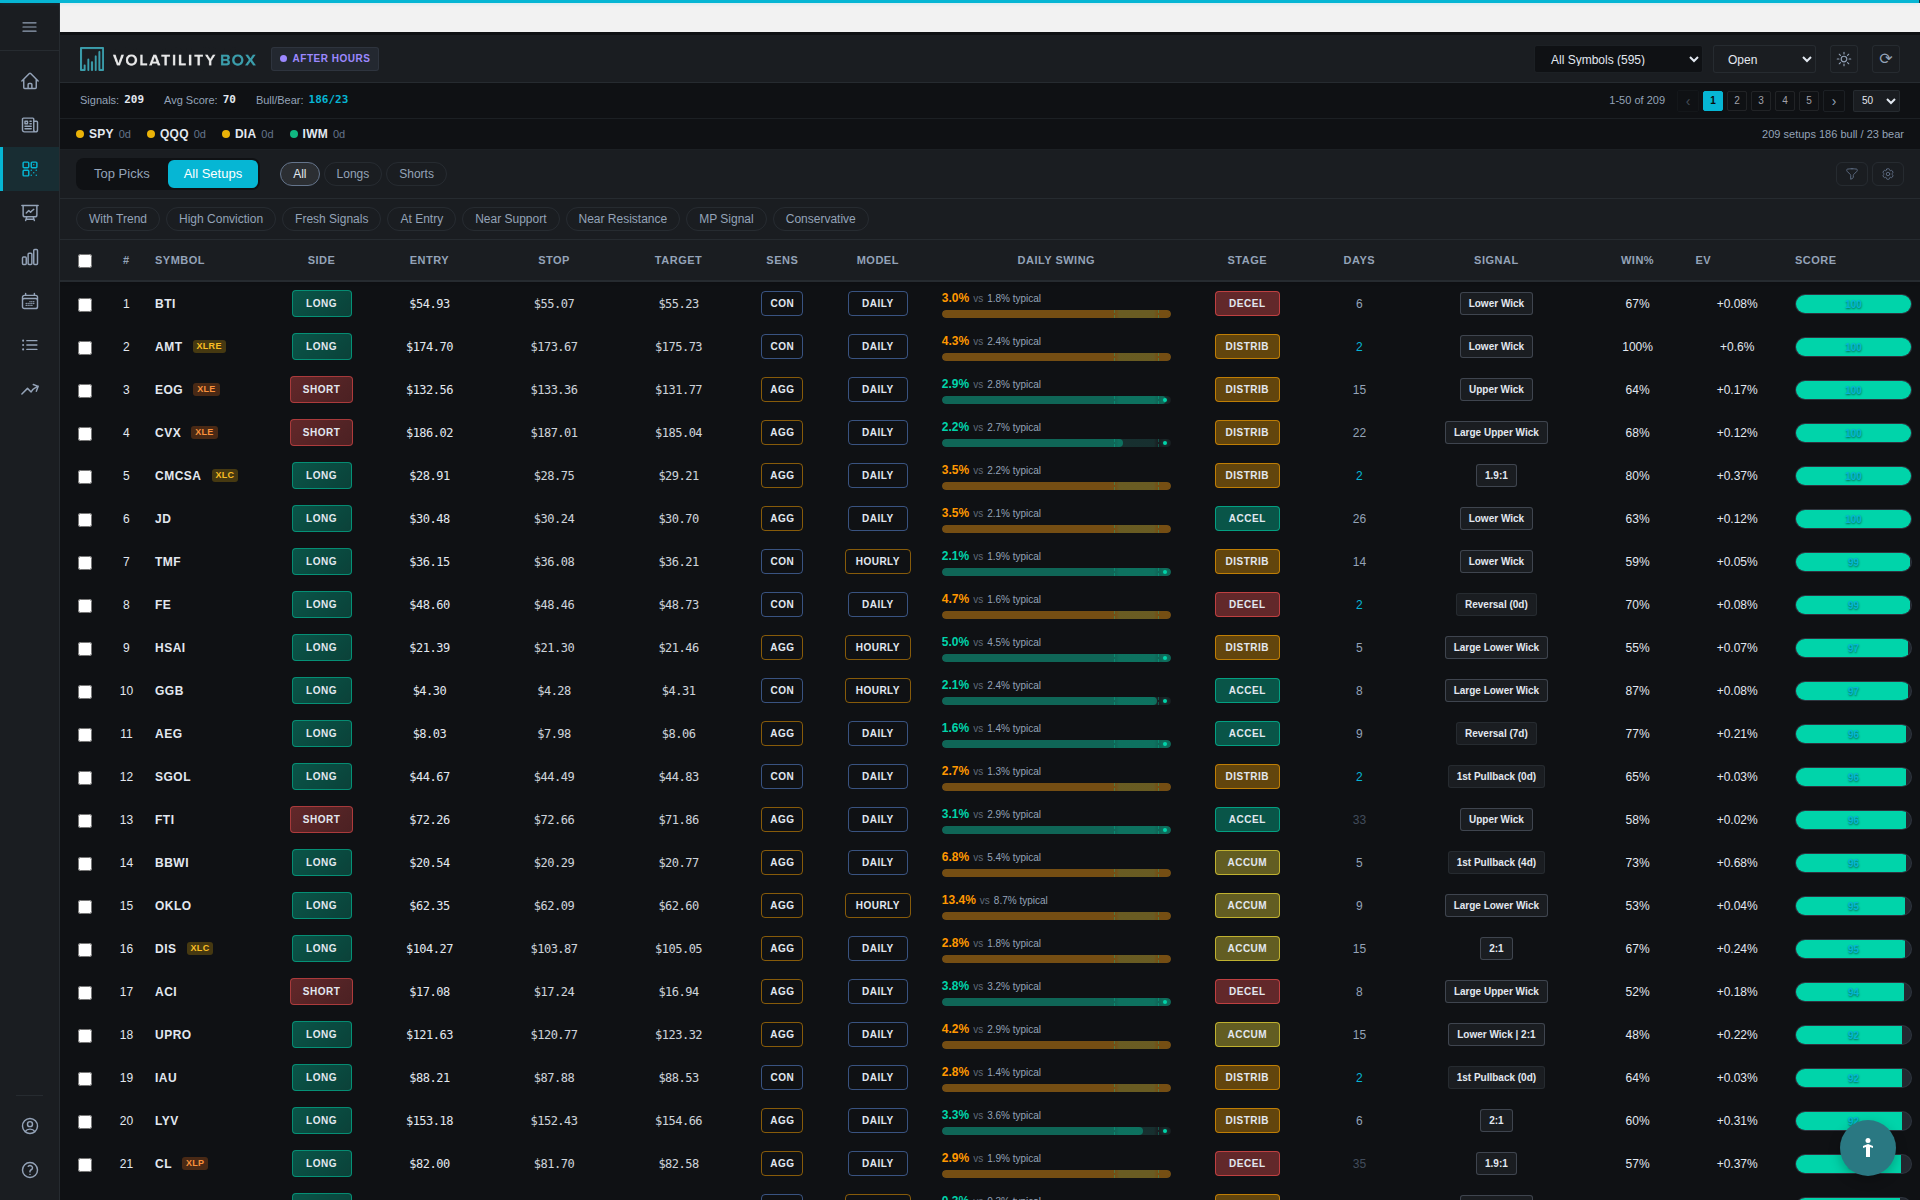
The Scanner runs the model, the breach, and the confluence layers across the universe and ranks the result by a letter grade, from A+ down through A and B. Read it top down. Click any row to load its chart and trade levels in the right panel.
Row fields
| Field | What it shows |
|---|---|
| Grade | Edge rank, A+ down through A, B, and lower |
| Symbol and direction | Ticker, long or short |
| Stage | Market Pulse regime on the daily timeframe |
| Model | Which model fired, daily or hourly |
| Edge | Backtest win rate and expectancy for the setup |
Right panel
| Field | What it shows |
|---|---|
| Chart | The selected name with the models plotted; toggle 1 minute, 5, 15, 1 hour, daily |
| Entry | The breach level |
| Stop | Stop level, outside the clouds on an at-the-edge breach |
| First target and second target | First profit target and the runner exit |
| Backtest stats | Win rate and trade count for the setup, shown in parentheses by the entry |
| Support, resistance, trade checks | Levels and the setup checklist for the decision |
Filters
| Filter | Options |
|---|---|
| Setups list | All setups, or a saved watchlist |
| Direction | Long only, short only, or all (toggle) |
| Trend | Trend or counter-trend |
| Swing and volatility | Setups where today’s swing is larger than baseline, or volatility is in line with the model |
| Entry proximity | Entry-only shows setups at or better than the entry price |
| Model and sensitivity | Daily or hourly, aggressive or conservative, or all |
| Risk and reward | Skew by reward-to-risk, or for entries closer to the stop |
| Regime stage | Acceleration, accumulation, distribution, deceleration |
The Close tab lists setups that recently hit target or stopped out, useful for reading which names are reacting at the model levels.
Charts reference
Enter a symbol in the text box and press Enter to load it. The right side shows the price and the market stage, which is anchored to the daily timeframe and does not change as you toggle timeframes.
| Control | What it does |
|---|---|
| Timeframe toggles | 1 minute, 5, 15, 1 hour, daily |
| Daily and hourly model toggle | Switches between the daily and hourly Volatility Box models |
| Aggressive and conservative toggle | Switches the model sensitivity |
On the intraday timeframes the models plot over price. On the daily timeframe the models do not plot; the Market Pulse line shows the pullback level and the stage instead.
Backtester reference
Enter a symbol in the control panel on the left, choose the model, sensitivity, direction, and date range, then run it. The right side fills with three sections.
| Section | What it shows |
|---|---|
| Headline numbers | Summary stats, with expectancy and profit factor the two to watch; positive expectancy means the setup makes money per trade on average, and a profit factor above one means more dollars won than lost |
| Cumulative P&L curve | The running result over the test; a steady climb is the goal |
| Trade log | Every time the setup fired, trade by trade |
Related
Was this article helpful?
Still need help?
Can't find what you're looking for? Our support team is here to help.
Contact Support