V-Shaped Reversal Pattern
The V-Shaped Reversal Pattern is a high-probability reversal that occurs when price is sharply rejected from a Volatility Box cloud, snapping back the other way without pausing to consolidate. The decisiveness of that turn, a hard rejection rather than a gradual roll-over, is what shows one side of the market has been overwhelmed at the extreme. When it forms at a breach with the Edge Signal and the momentum cross confirming, it is one of the cleaner reversal setups the models produce.
Watch: Part 5 of the Volatility Box onboarding series.
What a V-Shaped Reversal Is
A V-shaped reversal happens when price breaches a cloud, reaches a statistically extreme level, and immediately reverses with strong momentum instead of consolidating or retesting. Get the direction right: a bullish V forms when price drops into the lower orange cloud and snaps back up; a bearish V forms when price pushes into the upper green cloud and rejects down. The sharp, immediate turn, with little consolidation at the bottom or top of the V, is the tell that buyers or sellers have been decisively beaten at that level.
Key Characteristics
The pattern shows a sharp move to the cloud forming the left side of the V, an immediate equally sharp reversal forming the right side, and minimal consolidation at the turning point. It is most reliable at a Volatility Box breach, where price has tagged at least the aggressive cloud, because that is a statistically significant extreme rather than an arbitrary level. Increased volume into the turn helps confirm the reversal has real participation behind it.
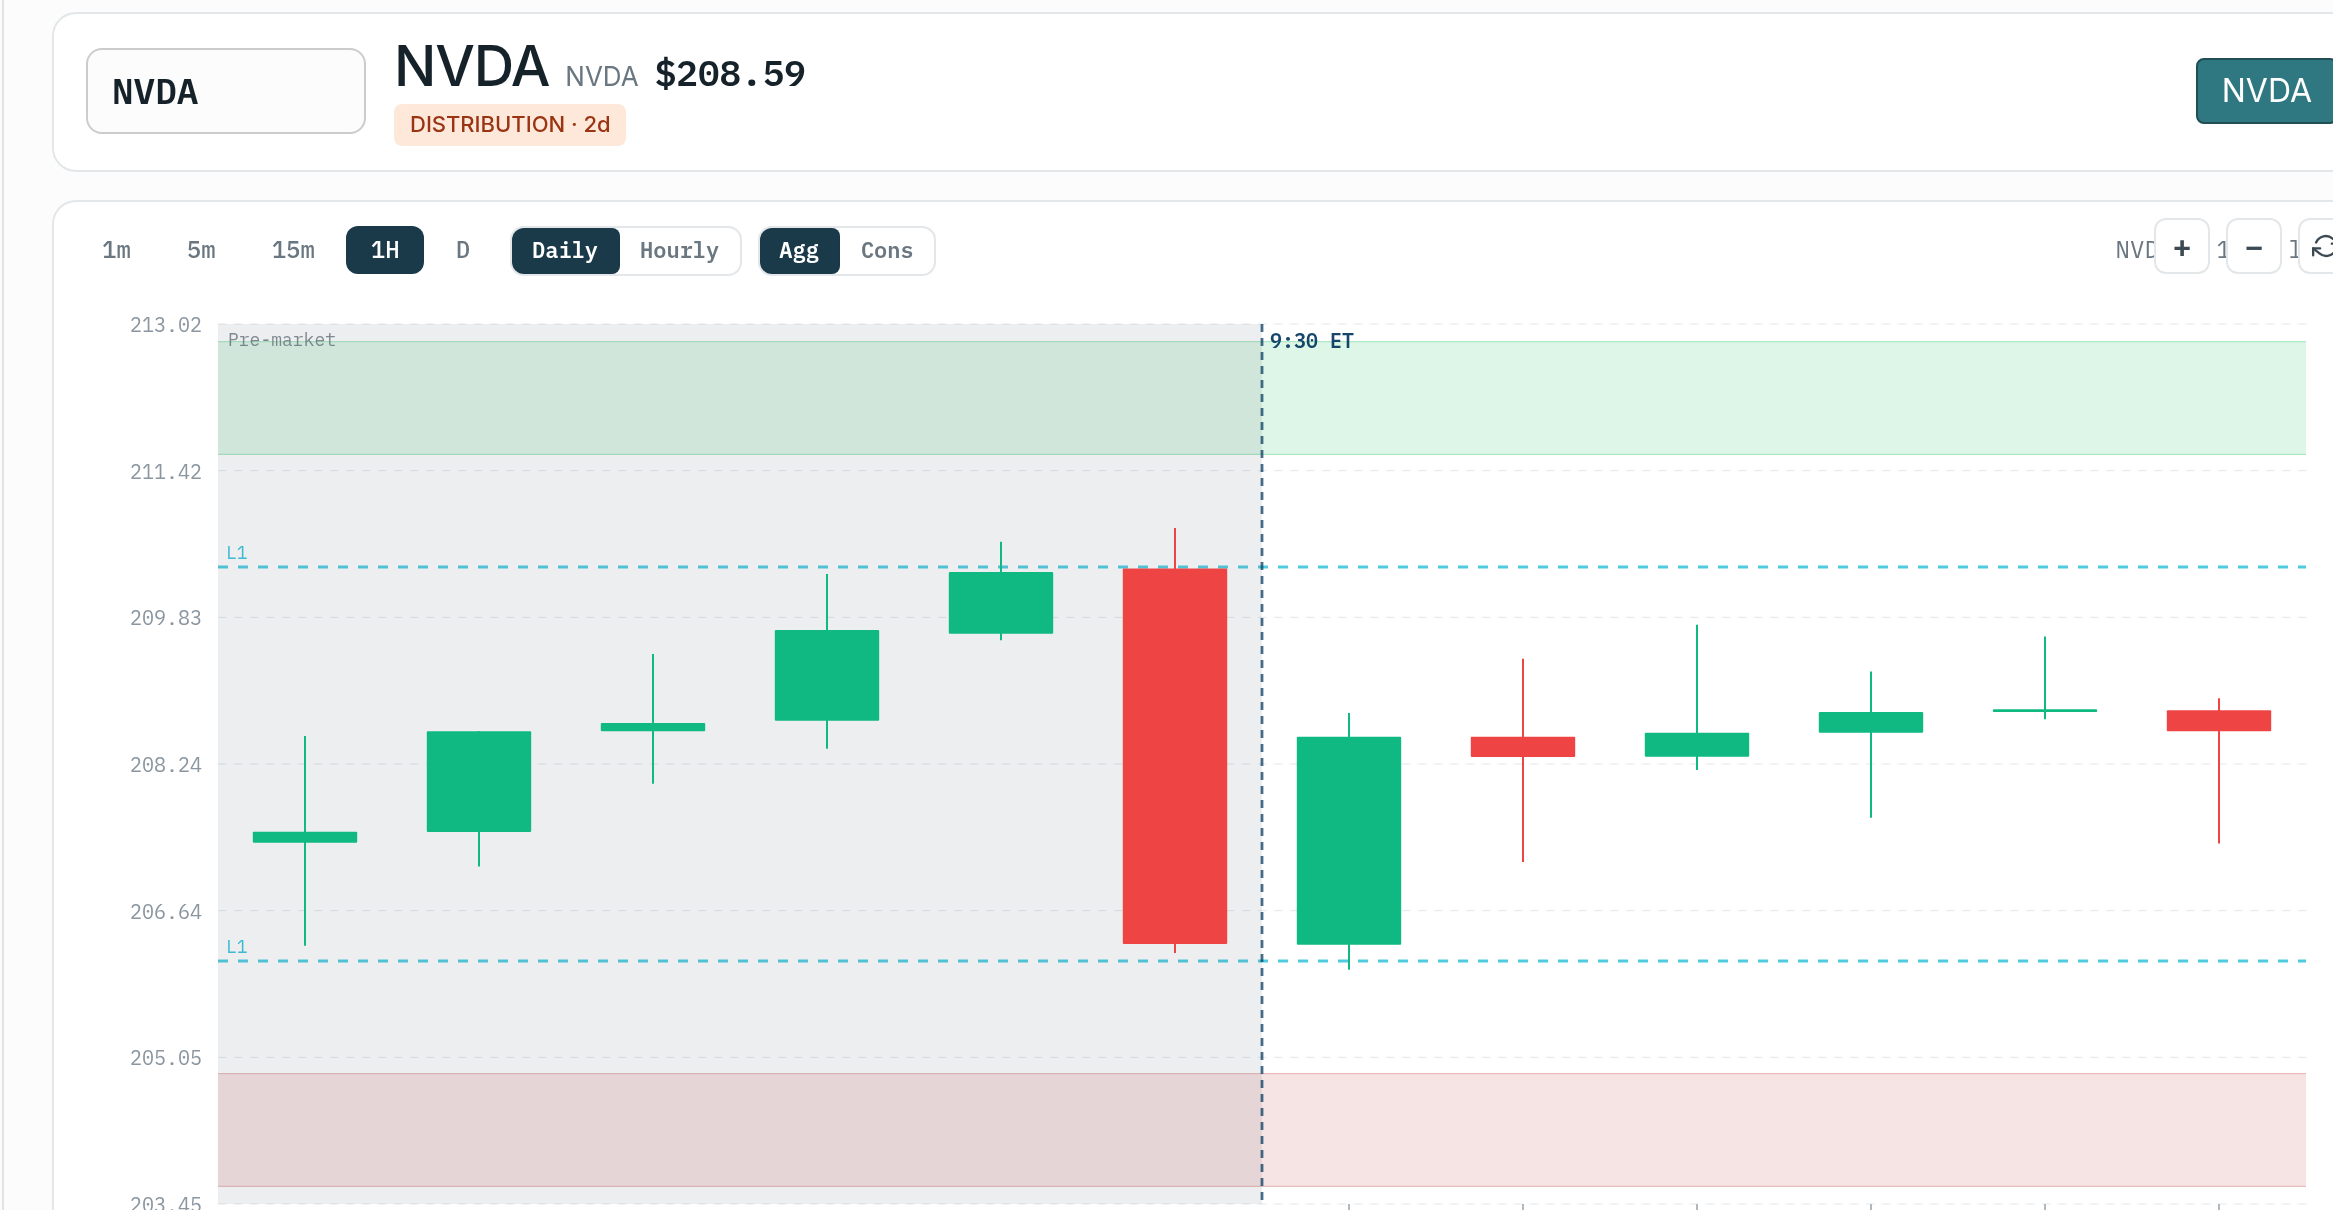
The Morning Breach Tell
One of the most useful reads happens in the first hour. Right at the open there is usually a spike in volatility that drives price straight into the hourly clouds, especially in key names like an NVDA or a MSFT, even when the broad indices are quiet. If you get a morning long-side breach and then see a clean V-shaped reversal off it, that is your clue that the model is being respected and buyers are present. It tells you to be happy buying the next long-side breaches that day, because buyers stepped in once and should be willing to step in again. The same logic mirrors for short-side breaches and sellers. The morning V is less a single trade than a read on whether the day will respect the models in both directions or call for a directional bias.
Confirmation: Edge Signal Plus the Momentum Cross
The visual V is the setup; the indicators are the proof. The Edge Signal should print at the extreme, the green or red arrow confirming price is officially overbought or oversold and the move is exhausting rather than just pausing. Then the 3/8 EMA momentum cross is the final tick: the 3 EMA crossing the 8 EMA is the easy-to-read clue that the direction is genuinely flipping and momentum is kicking in. A volume increase into the turn rounds out the confirmation. When the Edge Signal and the momentum cross line up on a breach, the V goes from a hopeful pattern to a validated setup.
Trading the V-Shaped Reversal: Step-by-Step
Step 1: Wait for the Breach
Wait for price to breach a cloud, tagging at least the aggressive model, where the statistical edge for a reversal is highest. Patience here matters; entering before price reaches the extreme cuts your probability. The deeper the breach into the cloud, the more the move is stretched and the more a snap-back becomes likely.
Step 2: Confirm the Reversal
Once price reaches the extreme, wait for the Edge Signal arrow, a sharp rejection candle, and the momentum cross to turn. Rising volume at the turn adds weight. When these align simultaneously, the setup justifies a full position within your risk rules.
Step 3: Enter the Trade
Enter once the reversal is confirmed, ideally on the first strong reversal candle with the Edge Signal in agreement. V-shaped reversals move quickly once they begin, so prompt execution after confirmation captures the best risk-reward. Waiting for a better price often means missing the trade.
Step 4: Set the Stop
Place the stop just beyond the extreme point of the V, below the V bottom for a bullish reversal, above the V top for a bearish one. Alternatively, on a deeper at-the-edge breach, use the outer edge of the clouds for a volatility-sized stop. Either way the stop is sized to current volatility, wide enough to survive brief continuation after entry but tight enough to invalidate cleanly if the reversal fails.
Step 5: Set Profit Targets
First target at 1:1 risk/reward to bank an initial profit and move toward break-even. Second target is the gray target line on the opposite side of the Volatility Box, the model’s expected full reversal. Take partial profits at the first target and let the rest run to the second with a break-even stop.
Step 6: Manage the Trade
Once the first target hits, move the stop to break even immediately so the position carries no risk. Consider closing 50% there and letting the remainder run to the second target. This staged management means the trade adds to your account even if the full target is never reached, important because V-reversals can retrace quickly after the initial thrust.
Enhancing V-Shaped Reversal Trades
Trend and Multi-Timeframe Context
A V-reversal that runs with the higher-timeframe trend (a bullish V inside an uptrend) is higher probability than one fighting it. Check the higher timeframe for context and use a lower timeframe for precise entry with tighter risk. For counter-trend Vs, the clue is distance: the farther price is from the Market Pulse line, the sharper the reversal tends to be.
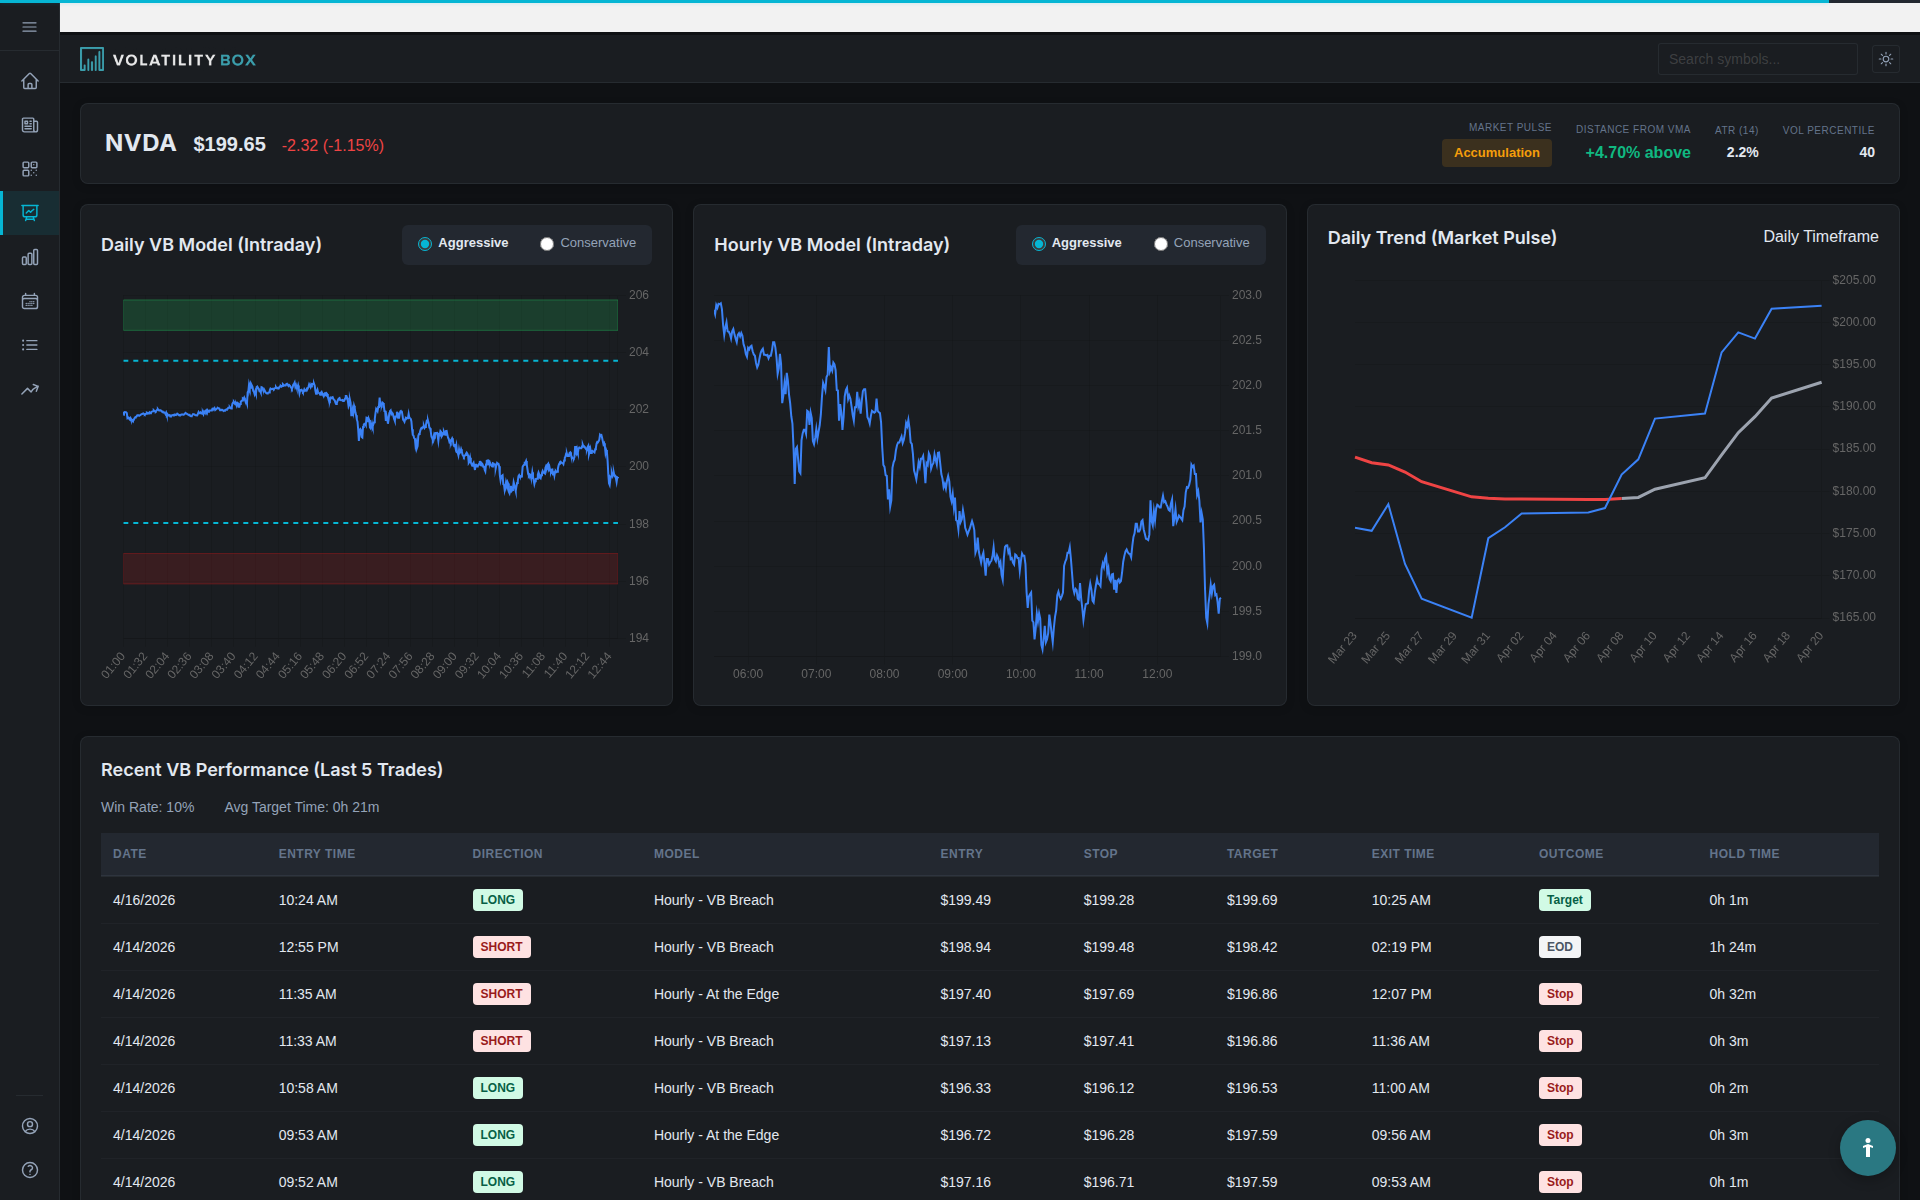
Market Pulse Alignment
V-reversals have higher odds when Market Pulse supports the direction. For a bullish reversal, favor the long-leaning stages of Accumulation and Acceleration; for a bearish reversal, the short-leaning Distribution and Deceleration. When Market Pulse strongly contradicts the reversal, reduce size or stand aside.
Cloud State
Read the state of the clouds before trading the V. If the clouds are compressed or inverted, volatility is too high, the high-to-low range has blown past twice normal, and a clean reversal is unlikely. That is one validated read telling you to sit out rather than fight twenty conflicting indicators.
Common Mistakes to Avoid
Entering Too Early
Entering before the Edge Signal and momentum cross confirm often means trading a continuation, not a reversal, and taking an immediate loss as price keeps running. Wait for confirmation even when the pattern looks likely; the price of patience is always less than the cost of a premature entry.
Using Fixed, Tight Stops
Stops placed at a fixed, arbitrary distance get clipped by normal fluctuation during a valid reversal, turning winners into losers. Size the stop to volatility, beyond the V’s extreme or outside the cloud, so you are not chopped out before the move develops.
Holding Too Long
V-reversals can retrace fast after the initial move. Take partial profits at the first target and protect the rest with a break-even stop rather than holding the full position for a perfect exit.
Ignoring Volume
Low-volume reversals lack the participation to sustain themselves and fail more often. Favor V-reversals with above-average volume at the turn; volume is the fuel, and without it even a clean-looking V often stalls.
Why V-Shaped Reversals Work
A V-reversal is decisive evidence that one side has been overwhelmed at a volatility extreme, creating a clear supply-and-demand imbalance that drives price the other way. The Volatility Box, built in 2018 by quant traders and engineers, marks where that extreme is, so the pattern is grounded in a statistically significant level rather than a hand-drawn line. The Edge Signal confirms exhaustion, the momentum cross confirms the turn, and volatility-sized stops keep the risk defined. Stacked together they make the V one of the more reliable reversal setups, though, as always, the edge is in taking them consistently and letting winners run, not in any single trade.
Related
Was this article helpful?
Still need help?
Can't find what you're looking for? Our support team is here to help.
Contact Support