The Today Page
What the Today page is for
The Today page answers two questions before any setup: is today worth trading, and if so, which direction. It reads as a funnel, from the broad market regime down to individual names, in the order the page is laid out. This guide covers each section top to bottom.
Watch: Part 2 of the Volatility Box onboarding series.

Market snapshot
The top of the page is the market snapshot: the whole market summarized in one sentence. A typical read names the index (SPY), its market stage, how many days it has held that stage, and its current momentum, for example SPY in an accumulation stage, day five, stalled and neutral. That single line is the regime read for the day.
Breadth, range, and leading sector
Three numbers sit under the snapshot:
- Market breadth. The percentage of names participating. A reading of 26% green means only about a quarter of names are green, a thin tape.
- Range. Today’s range against the typical range, expressed as a multiple. A reading of 0.8x means the market is moving narrower than a normal day.
- Leading sector. The sector driving the day’s move, and whether it is up or down. Technology down 2.63% is a red leader.
Read together, those three give the character of the tape. Thin breadth, a tight range, and a red sector leader describe a quiet, defensive day to size down on. That read lands before a single name is opened, which is the difference between trading with the market and forcing trades into chop.
The four index markets
Below the three numbers are the four index markets: SPY, QQQ, DIA, and IWM. Each is tagged with its market stage and how many days it has held that stage. When the four line up in the same stage, lean into that direction. When they split, for example the big indexes in accumulation while the small caps and the Dow push into acceleration, trade smaller and more selectively. The disagreement is itself information, and it stacks on top of the breadth-and-range read to form the bigger picture.
Sector rotation
Next is the list of sectors that are moving, sorted by today’s change. This is sector rotation at a glance: where money came in and where it is leaving. Financials at the front and technology at the back is one example of the rotation the list surfaces.
Where to focus
The “where to focus” section sorts all eleven sectors into four groups, which route longs and shorts to the right place:
- Leading is fresh strength, where the best long setups are found.
- Established is a trend already working, so longs come from buying pullbacks rather than chasing.
- Weakening is fresh deterioration, where short-side setups show up.
- Deceleration is a downtrend still intact, where shorts come from selling rallies.
The section keeps a strong name inside a quietly breaking-down group from being bought, and the reverse. Longs go in the leading and established sectors; shorts go in the weakening and decelerating ones.
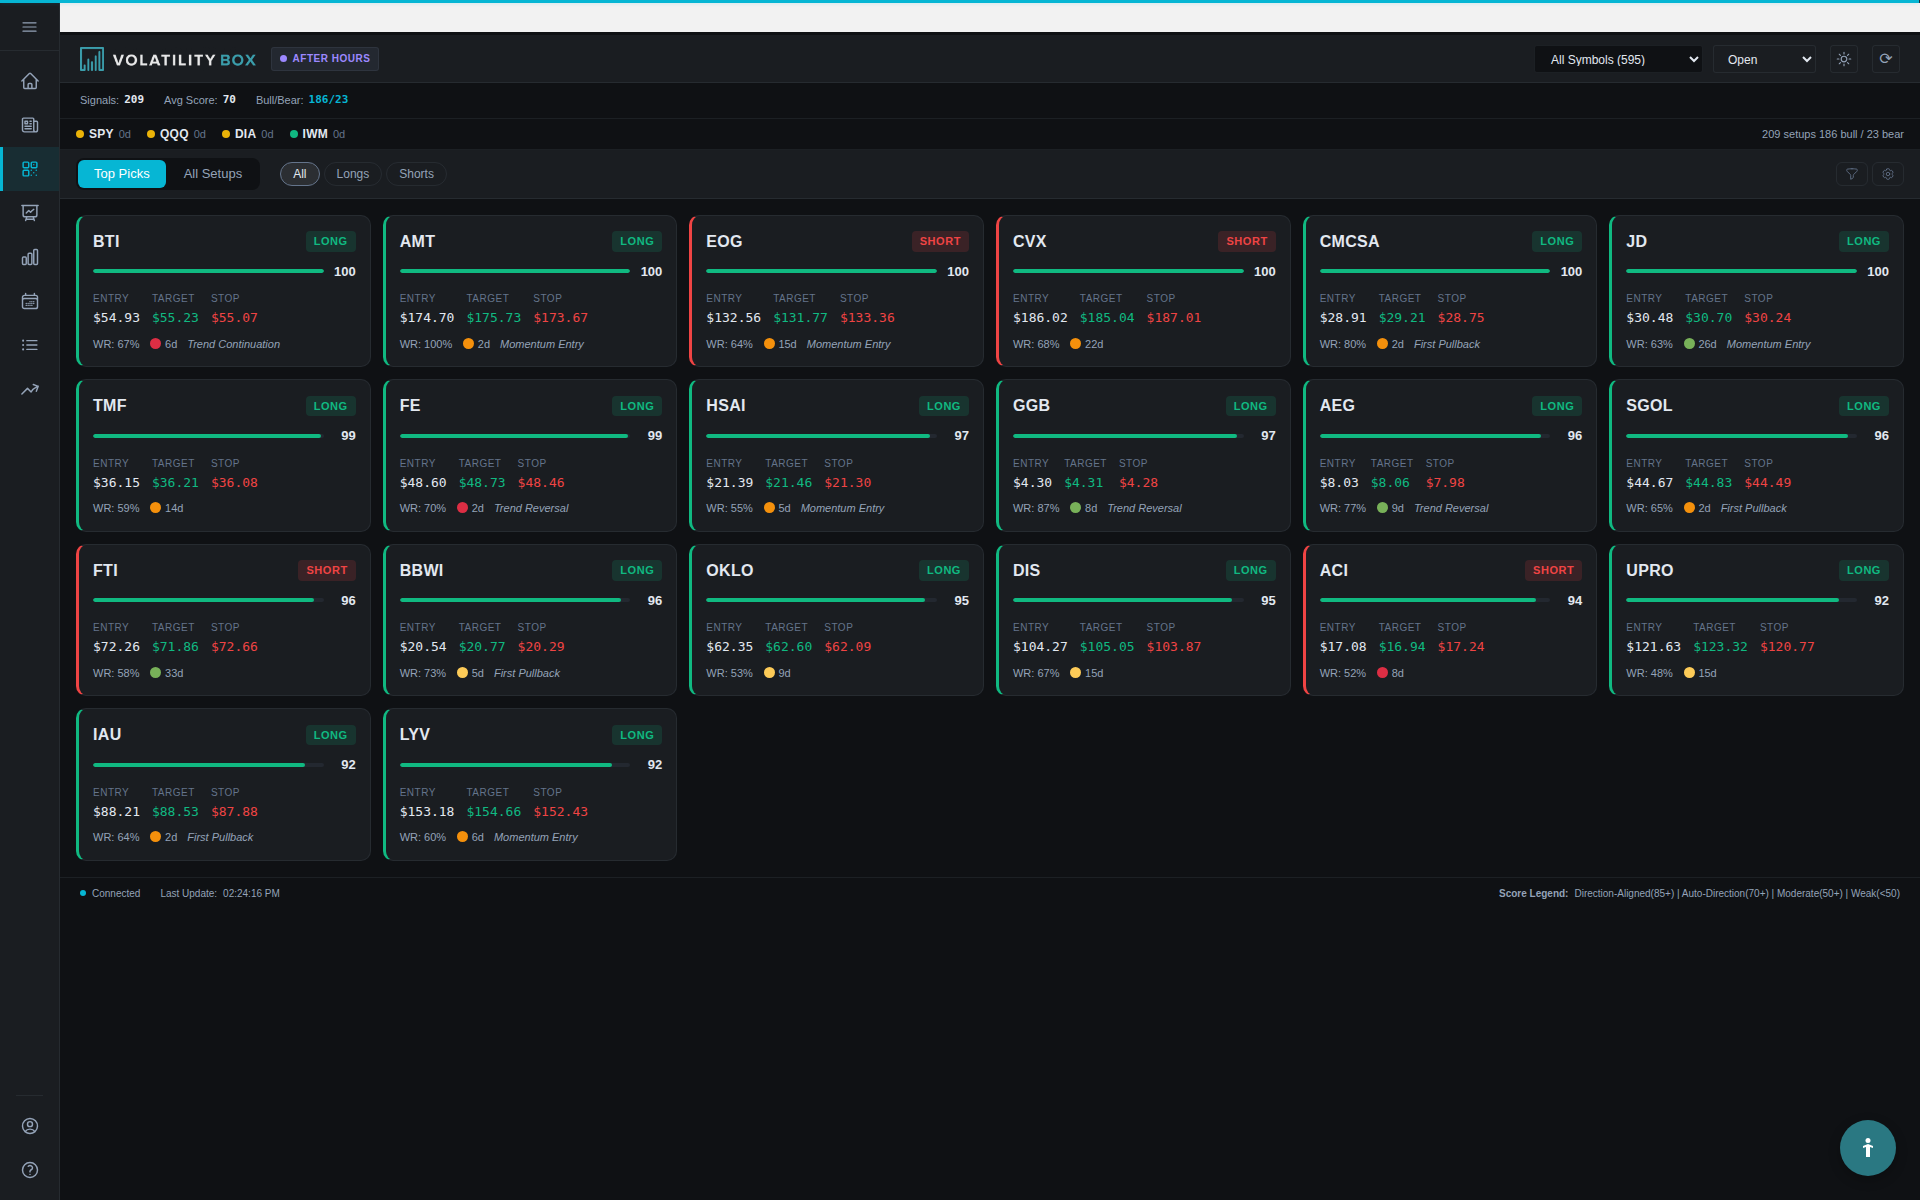
Top setups
At the bottom of the read are the top setups: the model’s shortlist of the ten names it has the most conviction in. A split such as four long and six short is itself a read on the tape. Each row gives the pattern, the timeframe, and the backtested numbers behind it, all drawn from the backtest results available inside the platform.
Broadcom (AVGO) as a daily trend reversal that has worked 82% of the time across 11 trades, returning +1.59R, is the format each row follows. Clicking a name opens the Charts view, where the models, the breach level, and the confluence can be read on the chart.
10-day breadth grid
Further down is the 10-day breadth grid. Each square is one trading day: green is trending up, red is chopping or trending down. This is context for everything above it, a market-internal read that surfaces clues the VIX does not. Watching where the breadth changes is how the page keeps you ahead of shifts in the tape.
Watchlist
The watchlist section is the model’s read on the names you track. For each symbol it shows the direction, the stage, which model it is running (daily or hourly, aggressive or conservative), and the levels on the right. It surfaces the exact setup and how it has performed historically, which matters most when one of those names is triggering today.
Closed today
At the bottom is “closed today”: every model trade that closed during the session, hit its target or stop, with prices. It is tape-reading context rather than a signal source, useful for spotting a sector or grouping of related symbols all triggering on the same day.
Reading the page as a funnel
The order is the point. The page moves from market regime, to direction, to side and sectors, to individual names. That funnel answers the two questions that matter before any setup: is today worth trading, and which way. On a thin, defensive, split-stage day the answer is to trade small and stay selective. Once the regime and direction are settled, a shortlist name goes to the Charts page to read how the models have projected its ranges.
Related
Was this article helpful?
Still need help?
Can't find what you're looking for? Our support team is here to help.
Contact Support