Symbol Page Analysis
What is the Symbol Page?
The Symbol Page serves as your visual confirmation center, providing a dedicated page for each symbol that displays live charts with Volatility Box levels, recent trade history, and Market Pulse context. Think of it as your “second opinion” tool before executing any trade, helping you verify that the setup aligns with your entry criteria.
Never enter a trade based solely on the Scanner table data. Numbers alone can be misleading without visual context. Always check the Symbol Page for visual confirmation that price is actually positioned at the VB entry level and the overall setup appears clean and actionable.
Accessing Symbol Pages
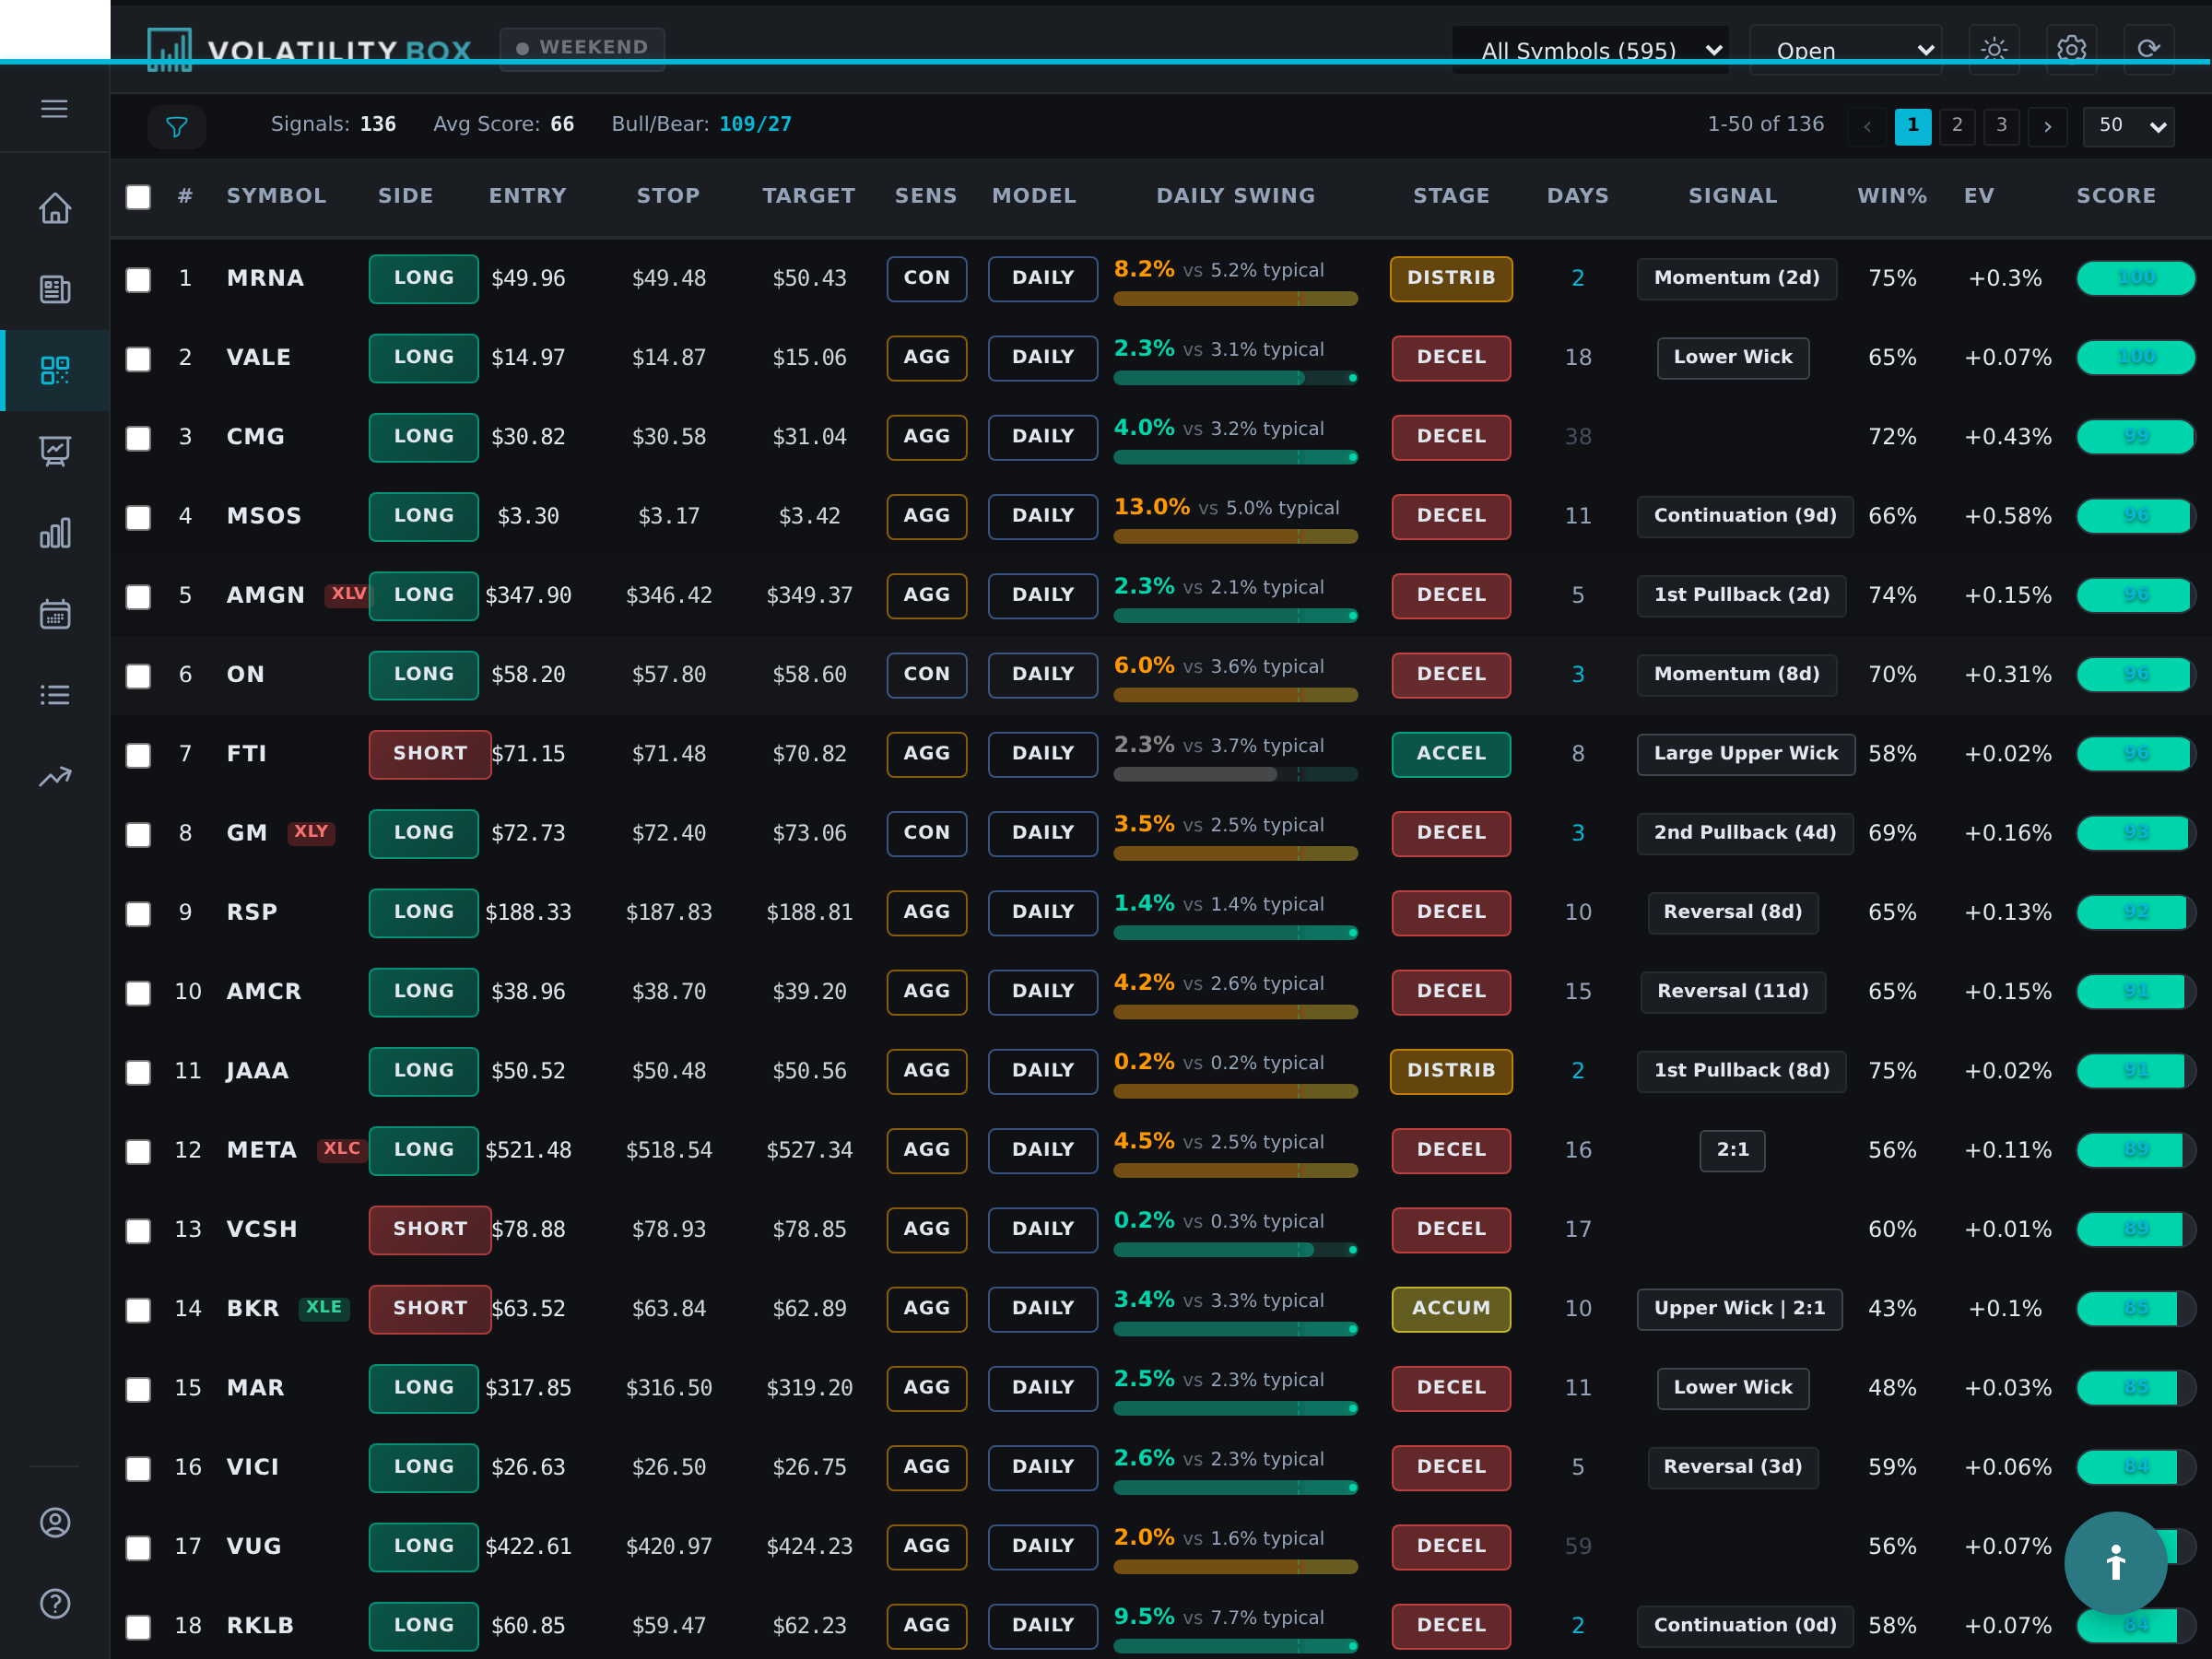
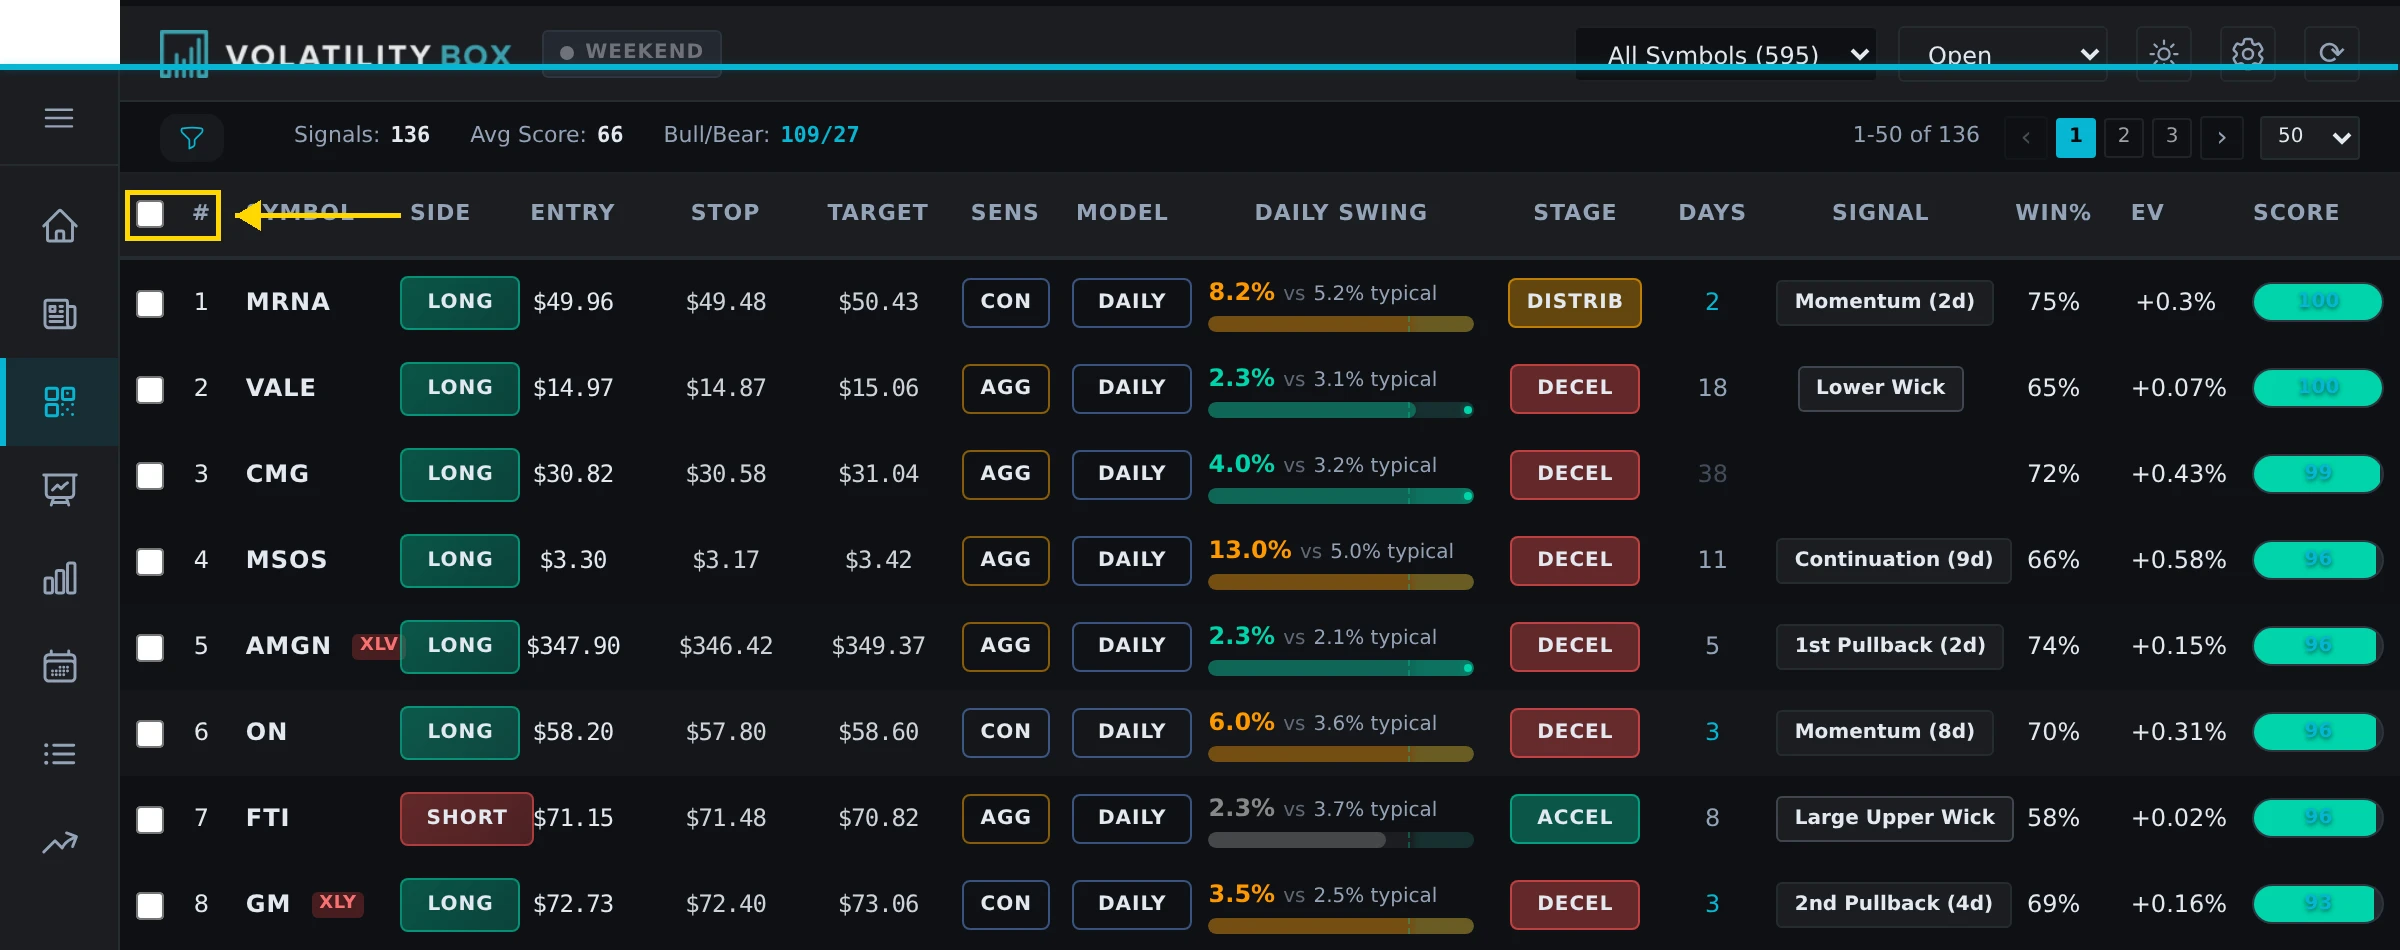
There are two primary methods to open a Symbol Page, each suited to different workflow preferences.
- From Scanner Table: Click the symbol name (e.g., “AAPL”) in the Scanner table. Opens Symbol Page in new tab.
- Direct URL: Navigate to
volatilitybox.com/symbol/AAPL(replace AAPL with any supported symbol)
Pro Tip: Right-click the symbol name and select “Open in new tab” to keep your Scanner table visible while reviewing the Symbol Page. This allows you to compare multiple symbols simultaneously.
Symbol Page Layout Overview
The Symbol Page is divided into 4 main sections, each providing distinct but complementary information.
Section 1: Header (Symbol Info)
- Symbol Name: Ticker symbol and company name
- Current Price: Real-time or 15-minute delayed price
- Today’s Change: Daily change in $ and %
- Active Signals: Current VB signals (LONG/SHORT) with conviction
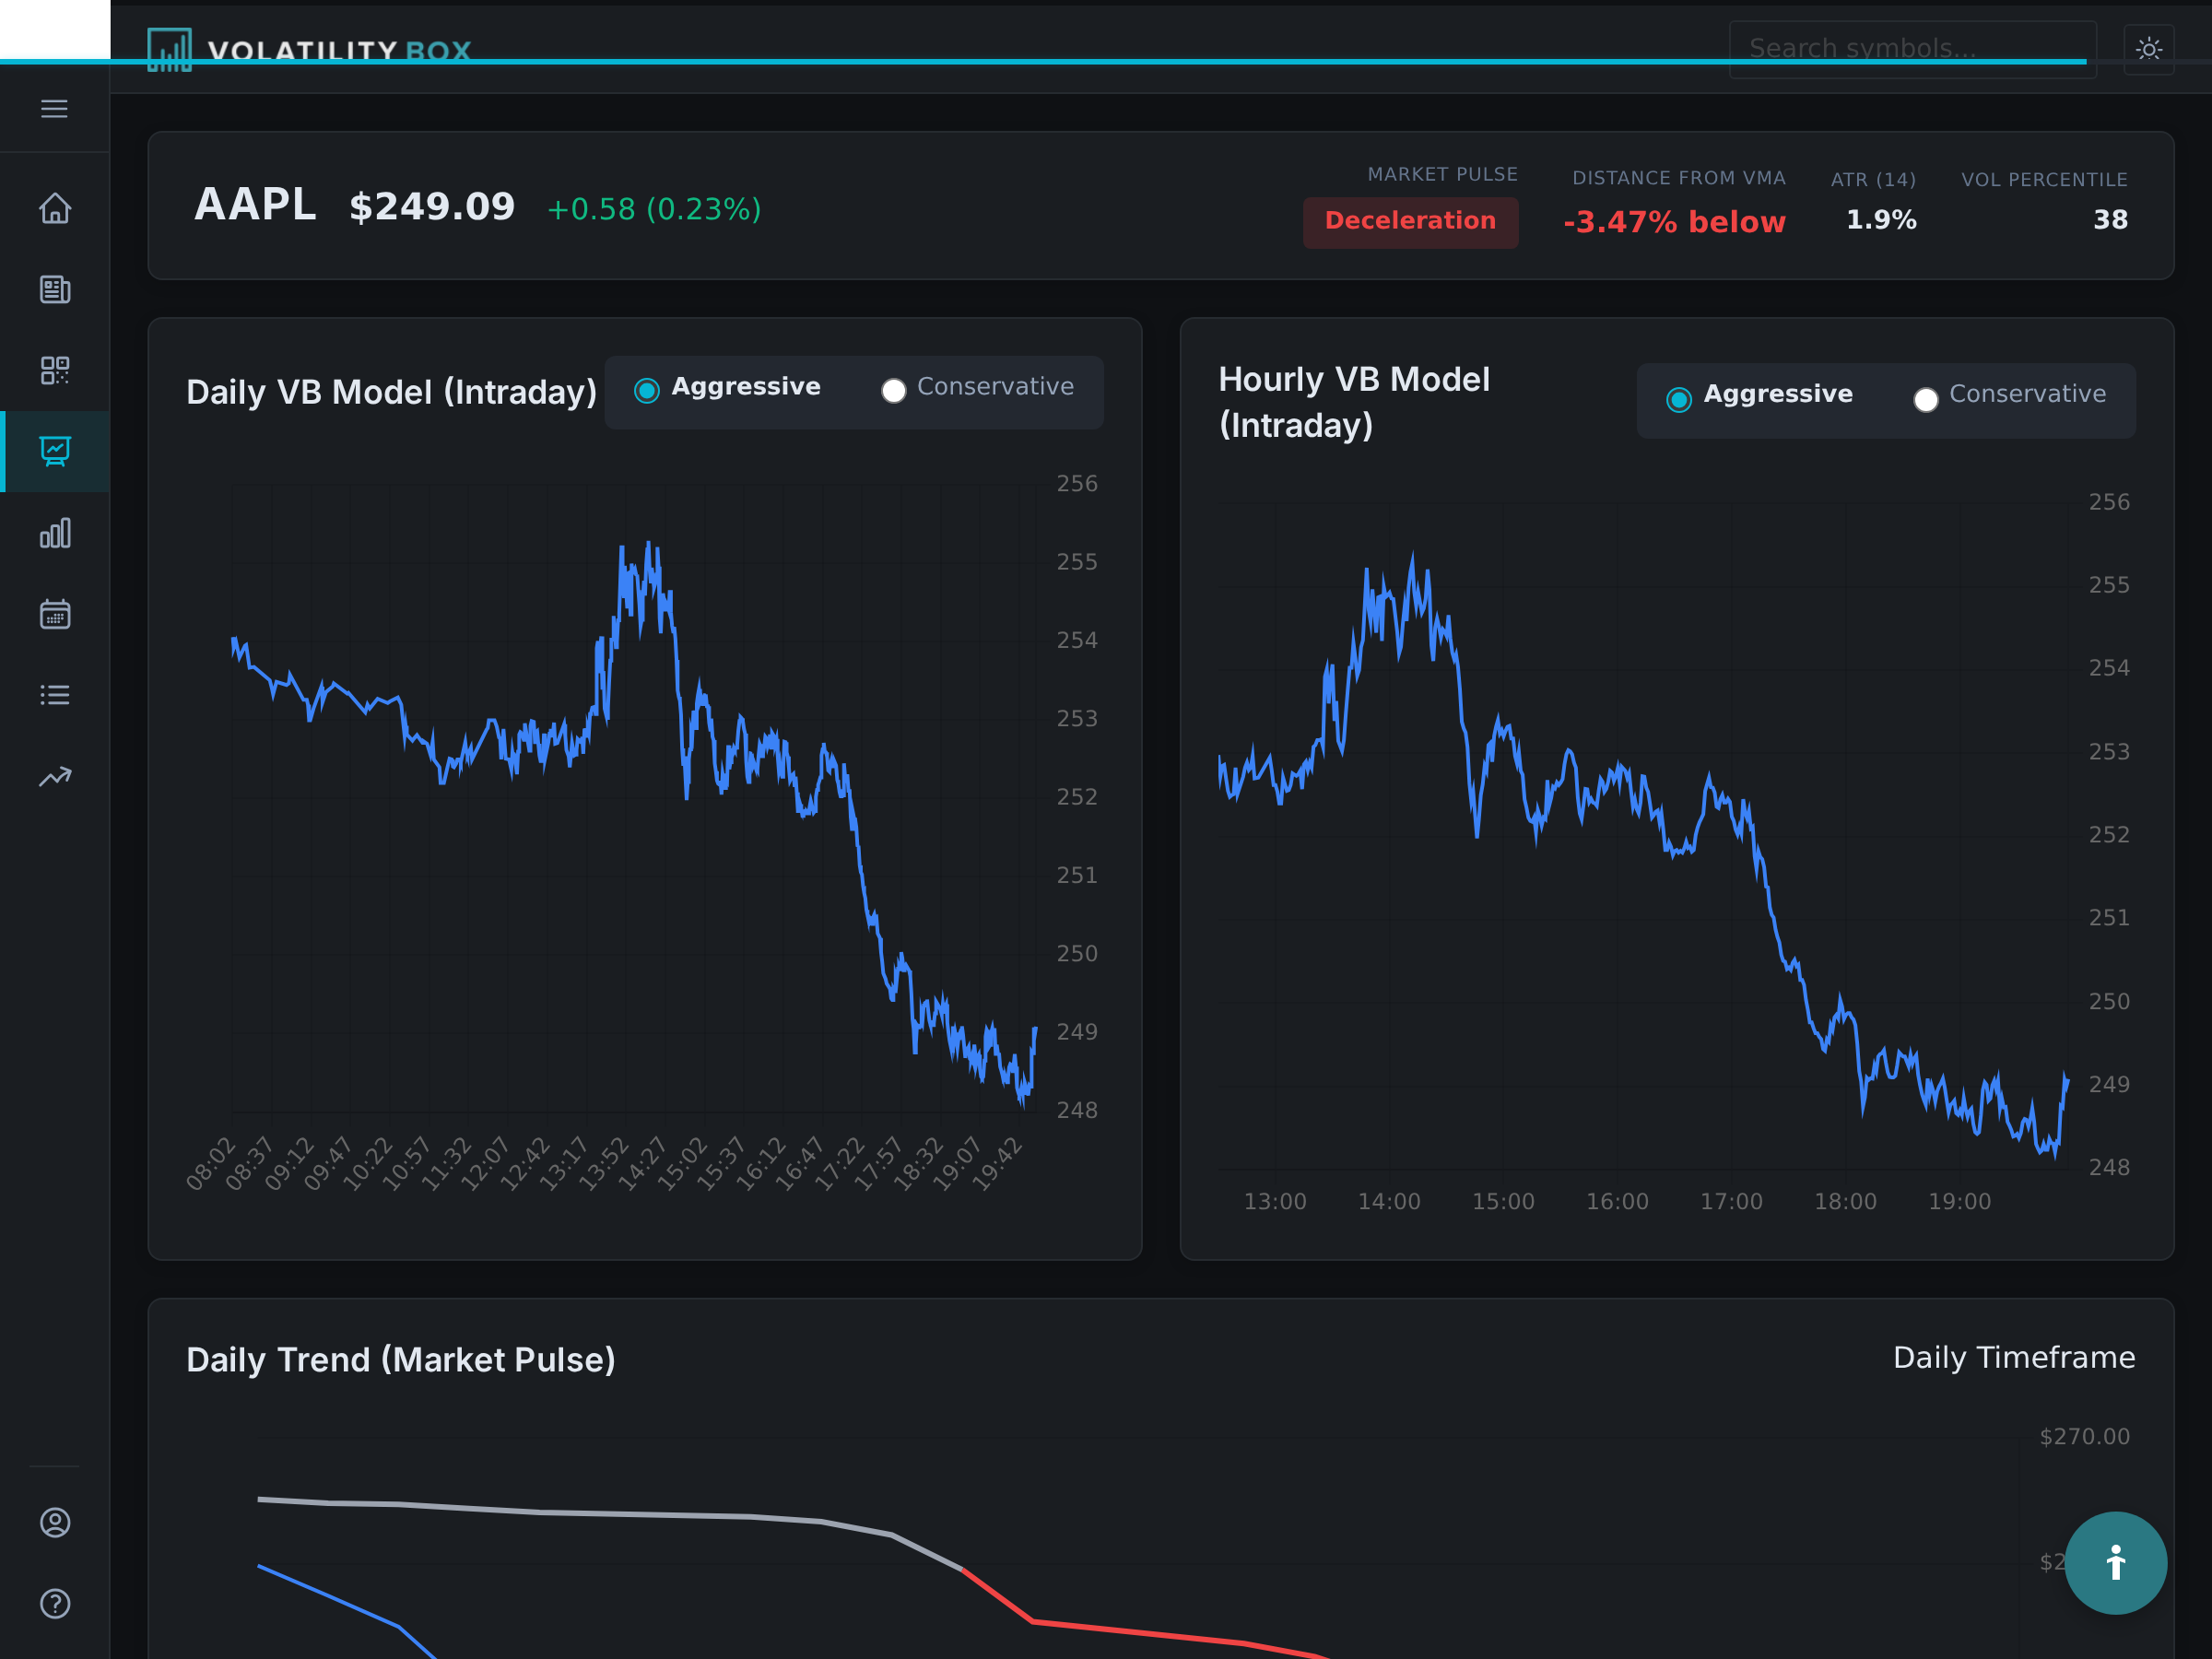
Section 2: Dual-Chart Layout
- Left Chart: Hourly timeframe with hourly Volatility Box levels
- Right Chart: Daily timeframe with daily VB levels
- Both charts show current price position relative to VB bands
Section 3: Recent Performance Table
- Last 5 VB trades on this symbol (historical)
- Shows entry, exit, outcome (Target Hit / Stopped / EOD)
- Win rate and P/L data for this specific symbol
Section 4: Market Pulse Daily Chart
- 150-day context chart with Market Pulse stages
- Color-coded trend stages (Green/Yellow/Orange/Red)
- Shows where current signal fits in the larger trend
How to Read the Dual Charts
The hourly and daily charts positioned side-by-side provide multi-timeframe confirmation that increases trade probability. When both timeframes align in the same direction, you have stronger evidence for the trade.
Hourly Chart (Left)
What to look for: The hourly chart reveals immediate price action dynamics and short-term momentum. Pay close attention to how price interacts with the VB levels and whether volume supports the move.
- Price touching or near VB entry level (green line for LONG, red for SHORT)
- Volume bars at bottom: Is volume present or dead?
- Candle patterns: Reversal candles (hammers, engulfing) increase probability
- Distance from baseline: How extended is the move?
Example: AAPL Hourly Chart
Price at $180.50, positioned just above the Hourly Aggressive LONG entry level at $180.40, indicating excellent timing for entry. The stop is clearly defined at $179.80 with a target at $182.00, providing a favorable risk-reward ratio. Volume has been increasing on the last 3 candles and a hammer candle formed on the previous hour. Verdict: Clean setup with multiple confirmations.
Daily Chart (Right)
What to look for: The daily chart provides big-picture context that prevents you from trading against the dominant trend. Understanding the overall trend direction and major support/resistance zones helps you select trades with the highest probability.
- Overall trend context: Is stock in uptrend, downtrend, or sideways?
- Major support/resistance levels: Any key levels nearby?
- Daily VB levels: Does hourly signal align with daily VB direction?
- Gap zones: Is there an unfilled gap that might pull price?
Example: AAPL Daily Chart
Stock is in a clear uptrend with higher highs and higher lows. Price has pulled back to the 20-day EMA at a support level where previous bounces occurred. A Daily Conservative LONG signal is also active at $179.50, providing multi-timeframe confluence, and there’s no major resistance until $185. Verdict: Strong multi-timeframe confluence with trend alignment.
Recent Performance Table: Symbol-Specific Stats
This table shows how Volatility Box signals have performed on THIS specific symbol over the last 5 trades. Some symbols respect VB levels better than others, and this historical data reveals which symbols are reliable.
Example: AAPL Recent Performance
| Date | Direction | Entry | Exit | Outcome | P/L |
|---|---|---|---|---|---|
| Jan 15 | LONG | $178.50 | $181.20 | Target Hit | +$2.70 |
| Jan 12 | SHORT | $182.80 | $183.10 | Stopped | -$0.30 |
| Jan 10 | LONG | $176.20 | $179.50 | Target Hit | +$3.30 |
| Jan 8 | SHORT | $180.00 | $177.80 | Target Hit | +$2.20 |
| Jan 5 | LONG | $174.50 | $177.00 | Target Hit | +$2.50 |
Win Rate: 80% (4/5)
Avg P/L: +$2.08/share
How to Use This Data
The performance data provides objective criteria for symbol selection, removing emotion from your trading decisions. High win rates indicate the symbol has consistent price behavior that responds well to VB methodology.
- High win rate (70%+): Symbol respects VB levels well, higher confidence
- Low win rate (<50%): Symbol choppy or doesn’t respect levels, skip or require higher conviction
- Recent losers: If last 2-3 trades stopped, symbol may be in transition, proceed cautiously
- Directional bias: If LONG trades consistently win but SHORT trades fail, focus on LONG signals only
Market Pulse 150-Day Context Chart
This chart shows the big picture trend cycle, revealing where the stock currently sits within its larger price movement pattern. Understanding the Market Pulse stage helps you determine whether you’re trading with the dominant trend or attempting a counter-trend reversal.
Market Pulse Stages (Wyckoff Cycle)
- Accumulation (Green): Smart money buying, trend starting
- Mark-Up (Yellow): Uptrend in motion, momentum strong
- Distribution (Orange): Smart money selling, trend ending
- Mark-Down (Red): Downtrend in motion, bearish momentum
The Market Pulse 150-day chart showing Wyckoff cycle stages with color-coded trend phases.
How to Use Market Pulse Chart
The Market Pulse stages provide context for evaluating signal quality and adjusting your trading approach. Signals that align with the current stage typically have much higher success rates than counter-trend signals.
- Current signal WITH trend: If LONG signal and chart shows Green/Yellow stage, higher probability
- Current signal AGAINST trend: If LONG signal but chart shows Orange/Red stage, reversal trade (riskier)
- Trend duration: If Green stage is 40+ days old, trend may be exhausting soon
- Recent stage changes: If just transitioned from Red to Green, fresh trend starting (ideal for trend-following)
Example: NVDA Market Pulse Chart
The 150-day chart shows 60 days spent in Red stage (Mark-Down phase) followed by a transition to Green stage just 5 days ago, indicating a fresh trend reversal. The current LONG signal carries an 82 conviction score. Interpretation: Fresh reversal at the early accumulation stage, creating a high probability trend-following setup.
Visual Confirmation Checklist
Before entering any trade, systematically verify these items on the Symbol Page to ensure all factors align. This checklist approach removes emotion and creates consistency in your decision-making.
| Check | What to Verify | Good Sign | Bad Sign |
|---|---|---|---|
| Price Position | Is price at VB entry level? | Within 0.10% of entry | >0.25% away from entry |
| Volume | Are volume bars present? | Increasing or steady | Below average or declining |
| Candle Pattern | Any reversal candles? | Hammer, engulfing, doji | No pattern or indecision |
| Support/Resistance | Clear path to target? | No major resistance | Heavy resistance zone ahead |
| Recent Performance | Symbol win rate 50%+? | 70%+ recent win rate | <40% recent win rate |
| Market Pulse | Signal WITH or AGAINST trend? | WITH trend (FP/TC) | AGAINST trend (TR) |
If 5-6 checks show “Good Sign” status, the trade setup is strong enough to enter with standard position sizing. If 3 or more checks show “Bad Sign” status, skip the trade entirely and wait for a cleaner opportunity.
Integration with Execution Workflow
The Symbol Page fits into your overall trading workflow as a verification step between signal identification and trade execution.
Step-by-Step Workflow
- Dashboard: See alert for new signal
- Scanner Table: Check conviction score (75+?)
- Symbol Page: Visual confirmation (price at entry? volume present?)
- ThinkOrSwim: Live chart verification with your studies
- Broker: Execute order
The Symbol Page represents step 3 in this sequence, serving as your “gut check” before committing capital to the trade. Skipping this step is one of the most common mistakes traders make. Taking these extra 60-90 seconds to verify the setup visually can prevent costly errors.
Common Symbol Page Mistakes
Awareness of common mistakes helps you avoid them and maintain disciplined analysis habits. These errors often occur when traders rush through analysis or allow excitement about a signal to override systematic verification.
- Skipping visual confirmation: Scanner says enter, but price already 0.30% past entry level (chase avoided by checking Symbol Page)
- Ignoring recent performance: Symbol shows 2/10 win rate but you enter anyway because conviction is 80 (symbol doesn’t respect VB)
- Overlooking Market Pulse: LONG signal looks good, but 150-day chart shows strong Red stage (trend reversal unlikely)
- Not checking volume: Charts look perfect but volume is 30% of average (trade will likely stall)
Advanced: Symbol Metrics Panel
Below the main charts, you’ll find additional symbol-specific metrics that provide deeper insight into the trading environment. These metrics help you adjust position sizing and set appropriate expectations for volatility and price movement.
Key Metrics Explained
- ATR (Average True Range): Daily price volatility. Higher ATR = wider stops, more volatile
- Volatility Percentile: Current volatility vs 90-day average (90th percentile = very high volatility)
- Distance from Baseline: How far price has moved from center line (very extended)
- 52-Week High/Low: Context for overall price range
How to Use Metrics
These metrics directly inform your position sizing and trade management decisions. High volatility requires reduced position sizes to maintain the same dollar risk level.
- High Volatility Percentile (>80): Expect wider VB bands and larger moves, adjust position size down 25%
- Distance very extended: Stock very extended, mean reversion more likely than breakout continuation
- Near 52-week high: Breakout may have resistance, but if WITH trend, momentum can carry through
Mobile Symbol Page Usage
On mobile devices, the Symbol Page automatically adapts to a vertical layout optimized for smaller screens. The functionality remains the same, only the layout changes for better mobile usability.
Mobile Layout
- Header (symbol info) at top
- Hourly chart (swipe to daily chart)
- Recent performance table (scrollable)
- Market Pulse chart at bottom
Mobile Workflow: Use Scanner on mobile to find signals, open Symbol Page for quick visual check, then switch to your broker app for execution. This entire process can be completed in 45-60 seconds once you’re familiar with the layout.
Summary: Symbol Page Checklist
- Access Symbol Page by clicking symbol name in Scanner table
- Check hourly chart: Price at VB entry? Volume present? Clean candles?
- Check daily chart: Overall trend? Support/resistance nearby?
- Review recent performance: Win rate 50%+? Last 3 trades profitable?
- Check Market Pulse 150-day: Current signal WITH or AGAINST trend stage?
- Verify 5+ items on visual confirmation checklist
- If all checks pass, proceed to ThinkOrSwim for final confirmation
- If 3+ red flags, skip trade and wait for cleaner setup
The Symbol Page is your second line of defense against bad trades, providing visual confirmation that complements the Scanner’s numerical data. Use it for every signal and every trade, without exception. Your win rate will improve when you make Symbol Page verification a non-negotiable part of your trading routine.
Was this article helpful?
Still need help?
Can't find what you're looking for? Our support team is here to help.
Contact Support