Scanner Workflow Optimization
What this workflow is
The fastest way to work the Scanner is top-down, in the order it already ranks setups, rather than reacting to whichever name pinged most recently. This guide walks the edge-ranked workflow: read from the top grade, shrink the list with filters, confirm in the detail panel, and use the Closed tab to see where volatility is building.
Watch: Part 6 of the Volatility Box onboarding series.
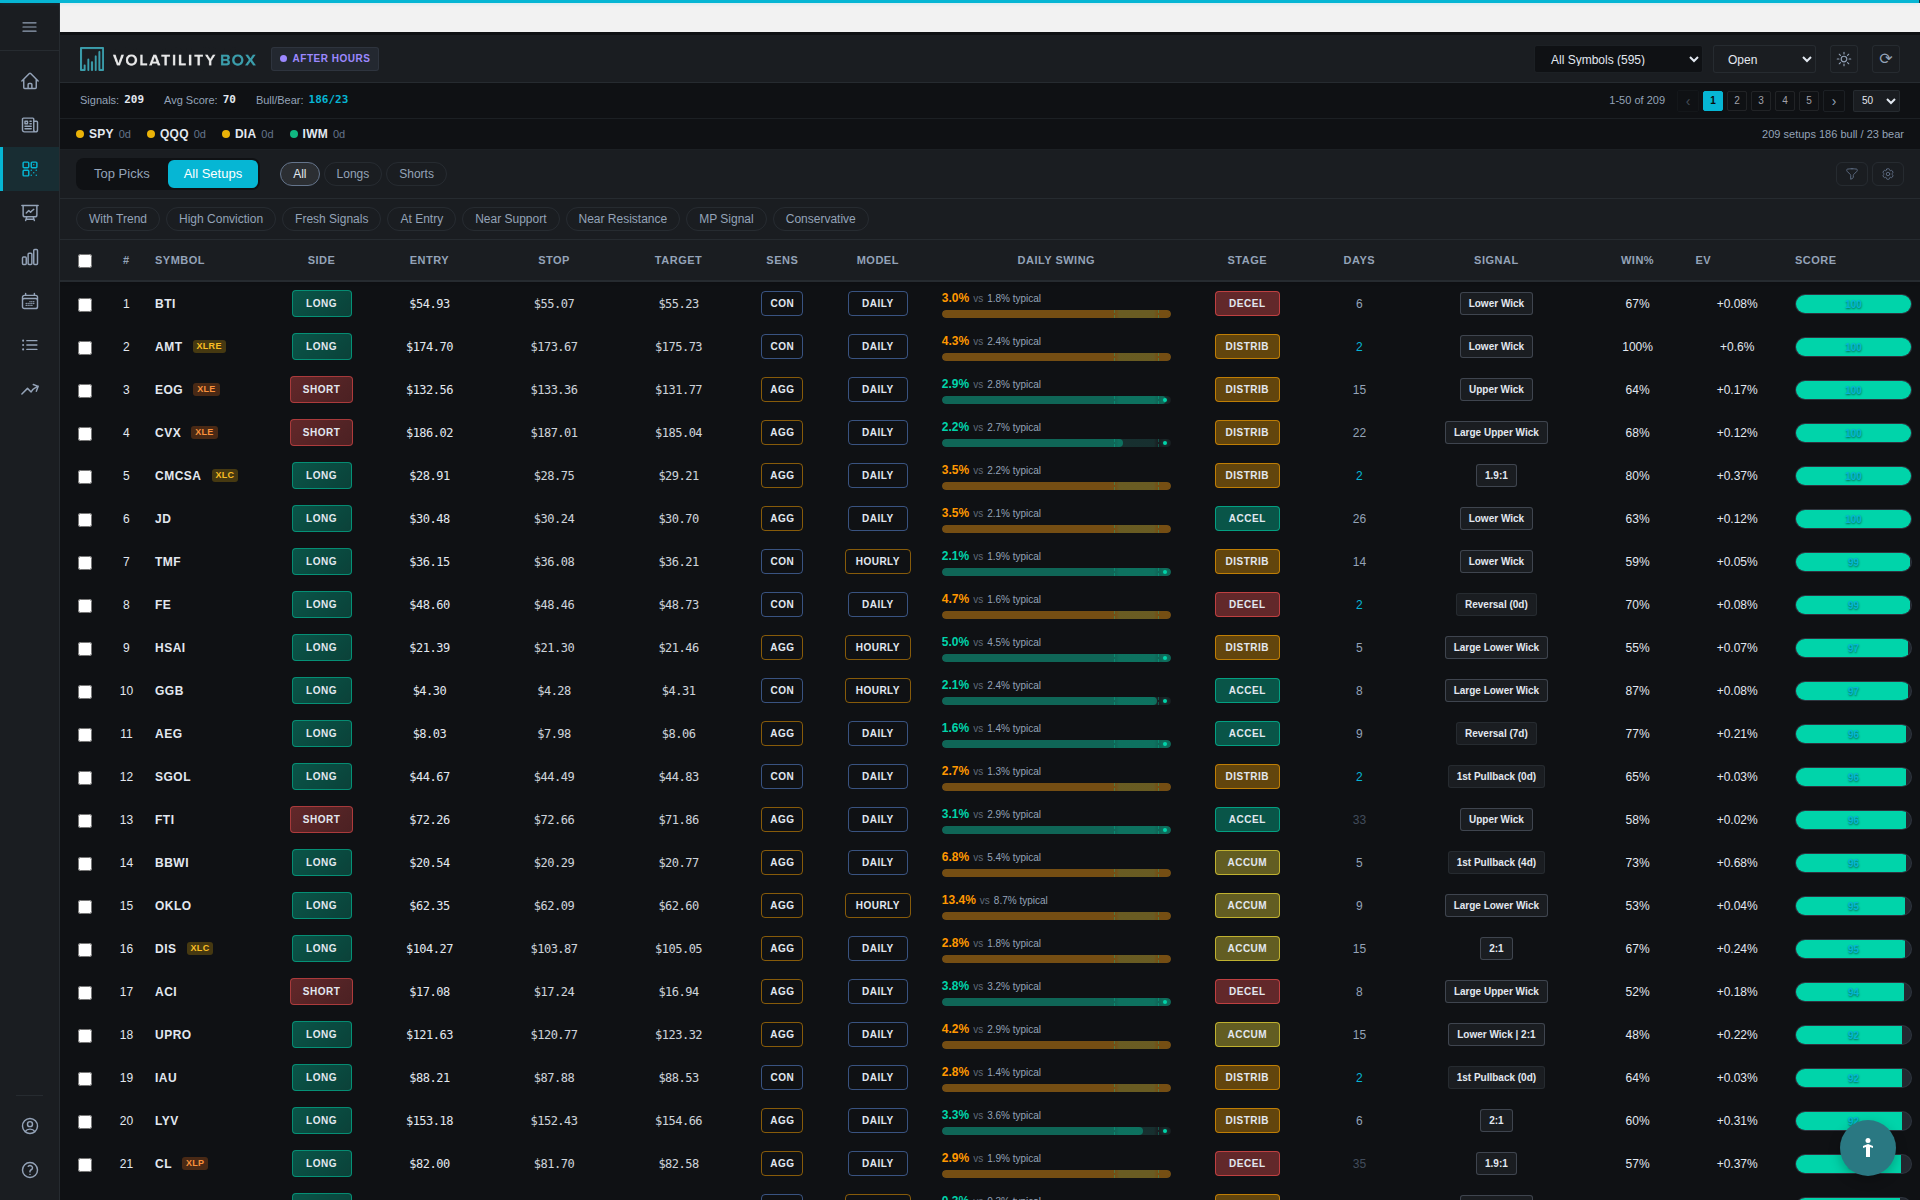
Read the list top-down
The Scanner is already ranked by edge, strongest setups at the top, so the work starts at the A+ grades and moves down. Reading top-down means never staring at a blank chart wondering where to look, and never reacting to whichever name happened to ping most recently.
That ordering is also the answer to alert fatigue. Most signal tools bury the screen in notifications with no sense of which one matters. Here the edge-ranked list and the saved filters decide what deserves attention, and the list is worked only as far down as the day’s plan allows. One validated, ranked volatility signal beats a stream of conflicting pings. The narrower the filters, the shorter the list, and the less effort it takes to ignore everything that does not fit the plan.
Set the bias first
Before the Scanner, the Today page sets the day’s bias: the Market Pulse stage and the long or short lean. Carrying that read into the Scanner is what the direction and stage filters are for. With the S&P in accumulation, day six, the lean is slightly bullish, so the long tab plus an S&P 100 filter can take a list of a hundred-plus down to the ten names that fit.
Shrink the list with filters
Apply the filters that match the day and the trading style:
- Direction to the day’s lean, long or short.
- Model and sensitivity to the timeframe being traded. When markets move, narrowing to daily or daily-conservative cuts the hourly noise.
- Entry proximity set to entry-only, so the list shows setups still near their level rather than ones already running to target.
- Regime / stage or a watchlist to focus on the names in play.
Saved filter presets make this one click. A preset that matches a given session can be loaded so the list is shaped before the first setup is read. The full set of controls is covered in Advanced filtering.

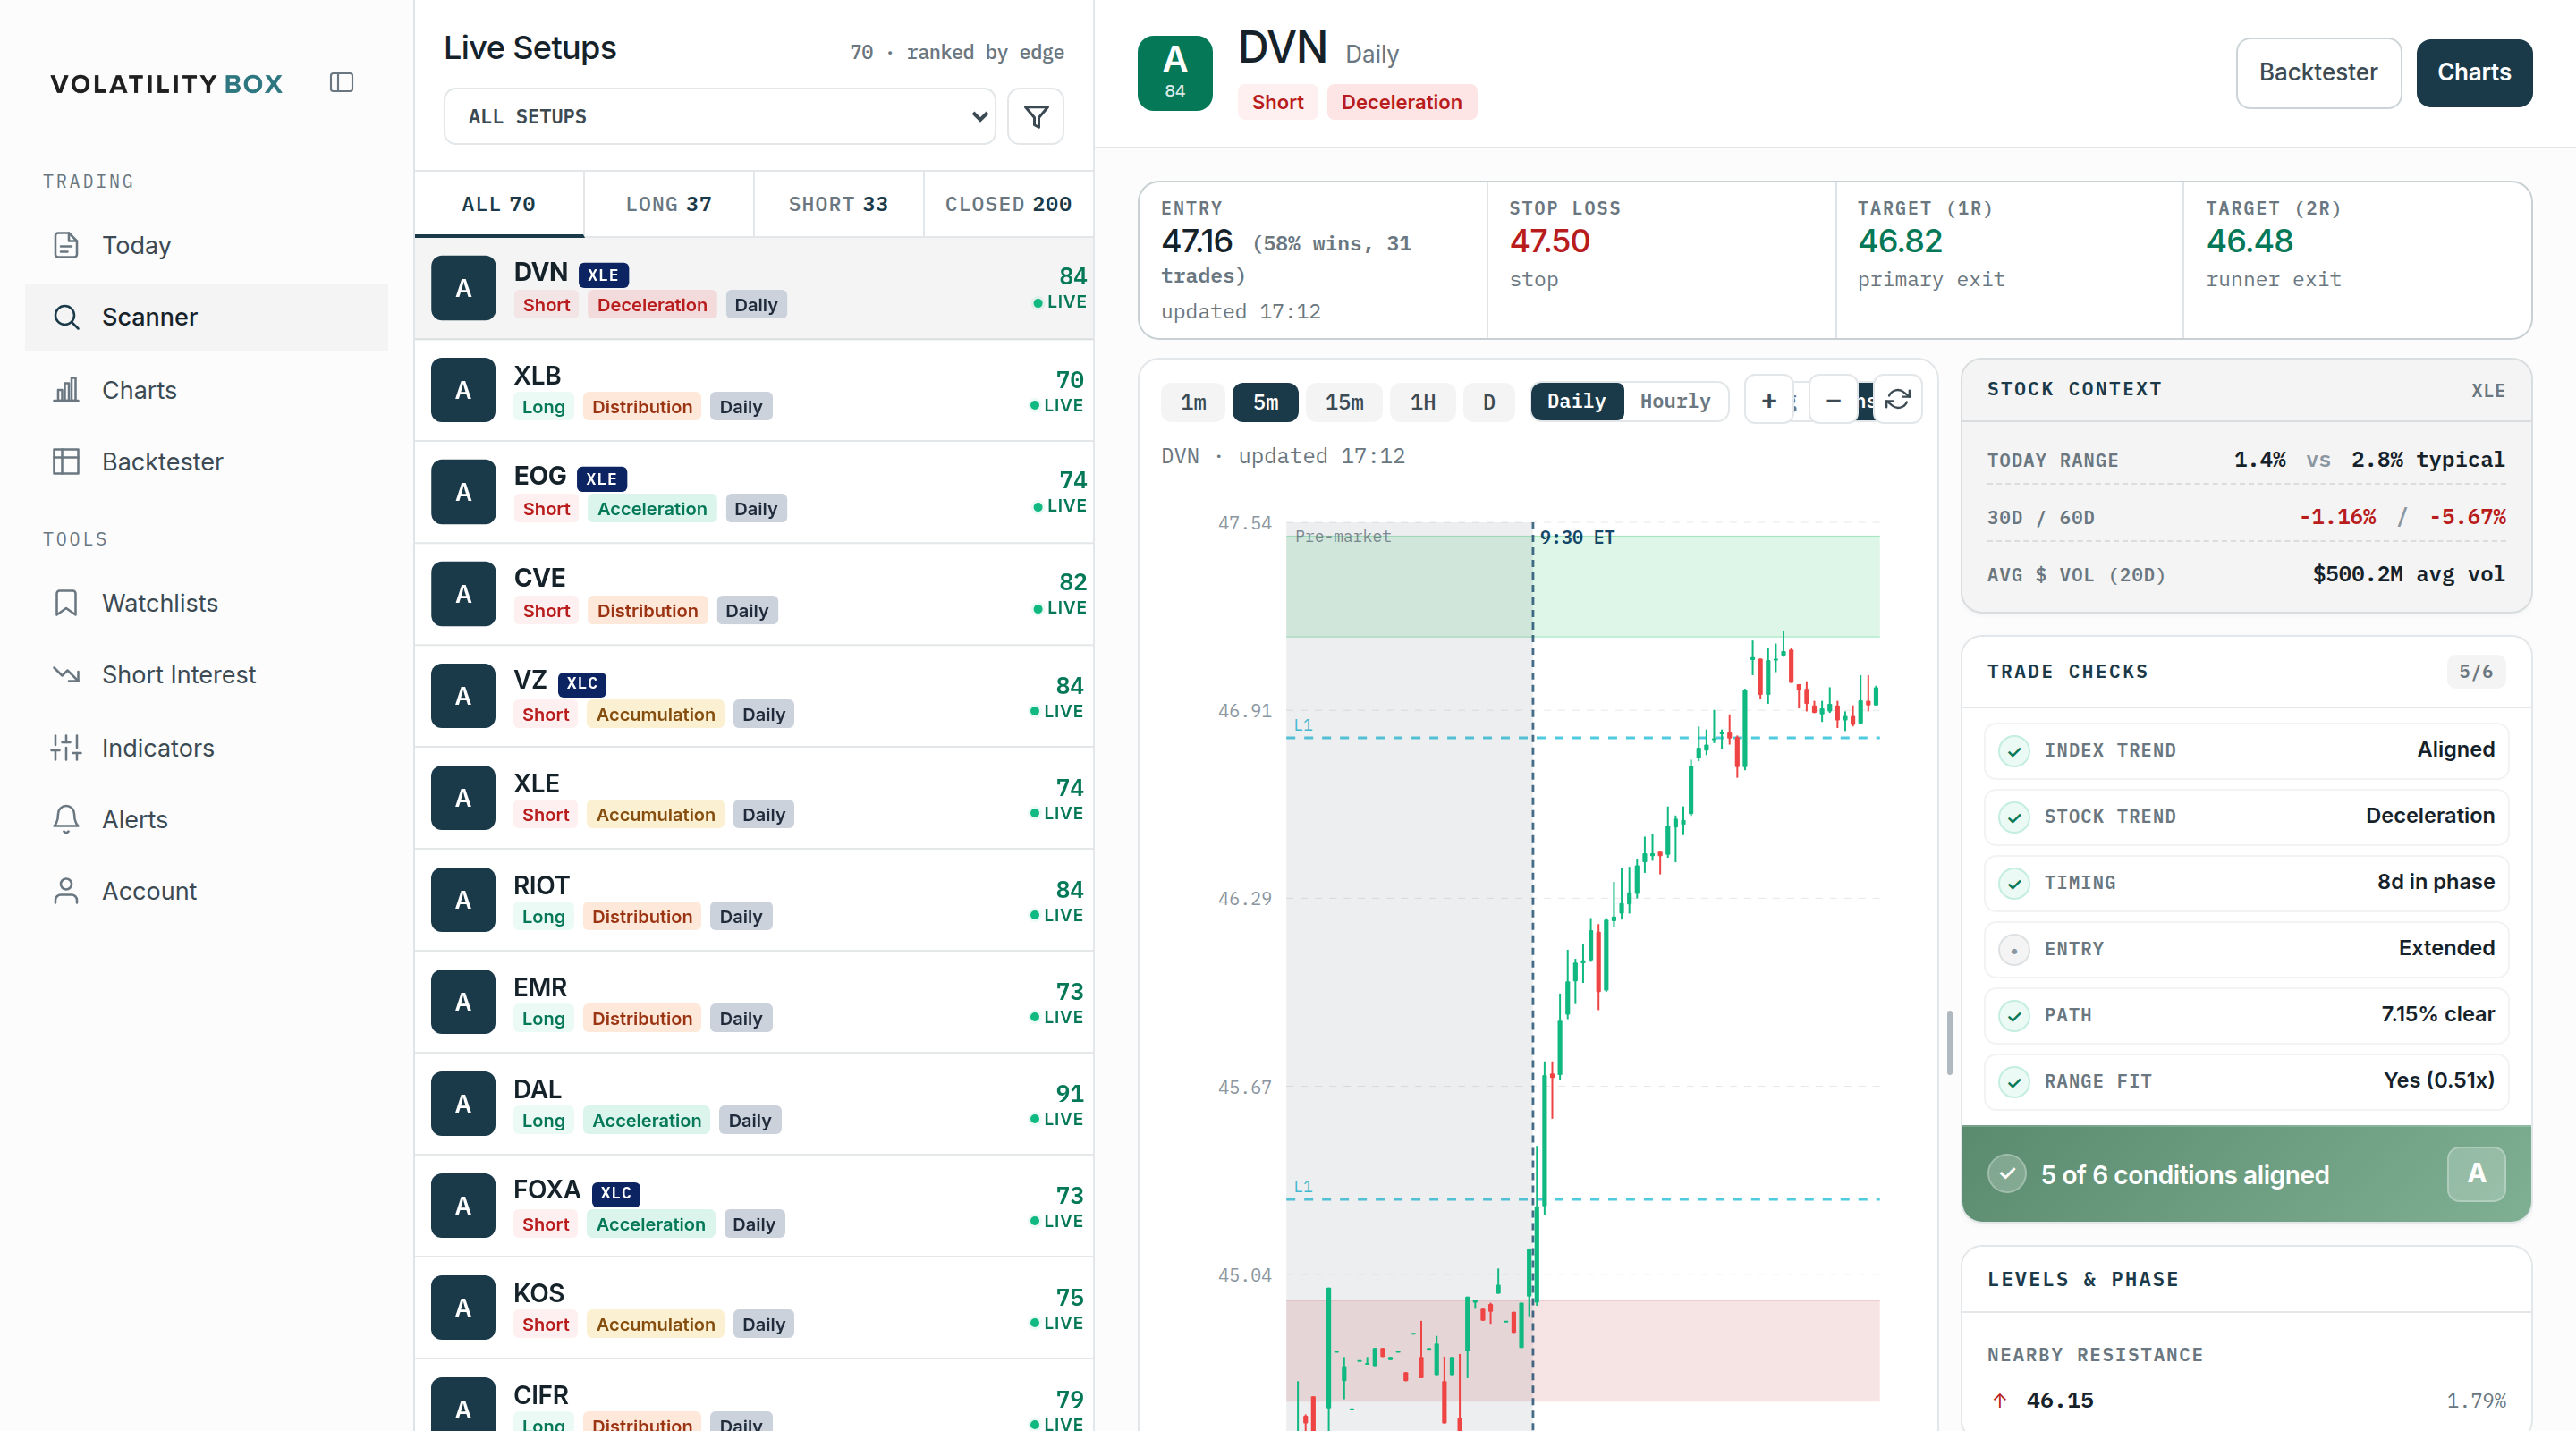
Confirm in the detail panel
Clicking a row fills the right side with everything needed to decide on the Scanner itself: the entry, stop, first target and runner exit, the backtest result for that exact setup, the chart loaded on the model that triggered, the stock context, the trade checks, and the nearby support and resistance. The chart carries the same timeframe toggles as the Charts page, so the breach can be confirmed without leaving the Scanner.
What to confirm before acting:
- Price is still at the cloud edge, not most of the way to target. A stale entry is a chase.
- The backtest win rate and expectancy read together. A high hit rate with thin expectancy still loses.
- The signal type and stage line up with the intended trade: TR is counter-trend against the stage, FP and ME are with-trend.
Size off the volatility-based stop
The stop sits outside a volatility-sized cloud rather than at a fixed distance, so position size comes from the distance to that stop. Sizing off a volatility-based stop is what keeps a stop from being placed inside the noise and chopped out on a routine swing.
Use the Closed tab
The Closed tab shows setups that already hit target or stopped today, and it flags where volatility is building. A name that just stopped on the aggressive model breached aggressive, which means volatility is rising in it, so the next breach toward the conservative model is what to watch for, often the better entry. On a day when a name is selling off through the aggressive models, the Closed tab is the early read on the conservative and daily breaches still to come.
The workflow, end to end
- Set the bias from the Today page: Market Pulse stage, long or short lean.
- Open the Scanner and apply the matching direction, model, and any watchlist or stage filters.
- Read top-down from the highest grade.
- Open a row, confirm price is still at its level on the chart, and read the backtest and trade checks.
- Size off the stop and execute.
- Watch the Closed tab through the day for names where volatility is picking up.
Worked this way, the Scanner is a running, ranked watchlist of setups. Dropping in at any point in the session shows what currently has a volatility edge and is giving an entry, without scrolling through everything that already moved.
Related
Was this article helpful?
Still need help?
Can't find what you're looking for? Our support team is here to help.
Contact Support