Market Pulse Signals
What Is Market Pulse?
Market Pulse is the Volatility Box’s trend-regime read. It’s the first of the four confluence layers you stack on top of a breach, and it answers a question the breach alone can’t: given the regime this name is in, should you even be taking this direction? The Volatility Box clouds tell you where the volatility edge is; Market Pulse tells you whether the trend at your back makes that edge worth trading. The breach is the trigger; the stage is the context.
Watch: Part 2 of the Volatility Box onboarding series.
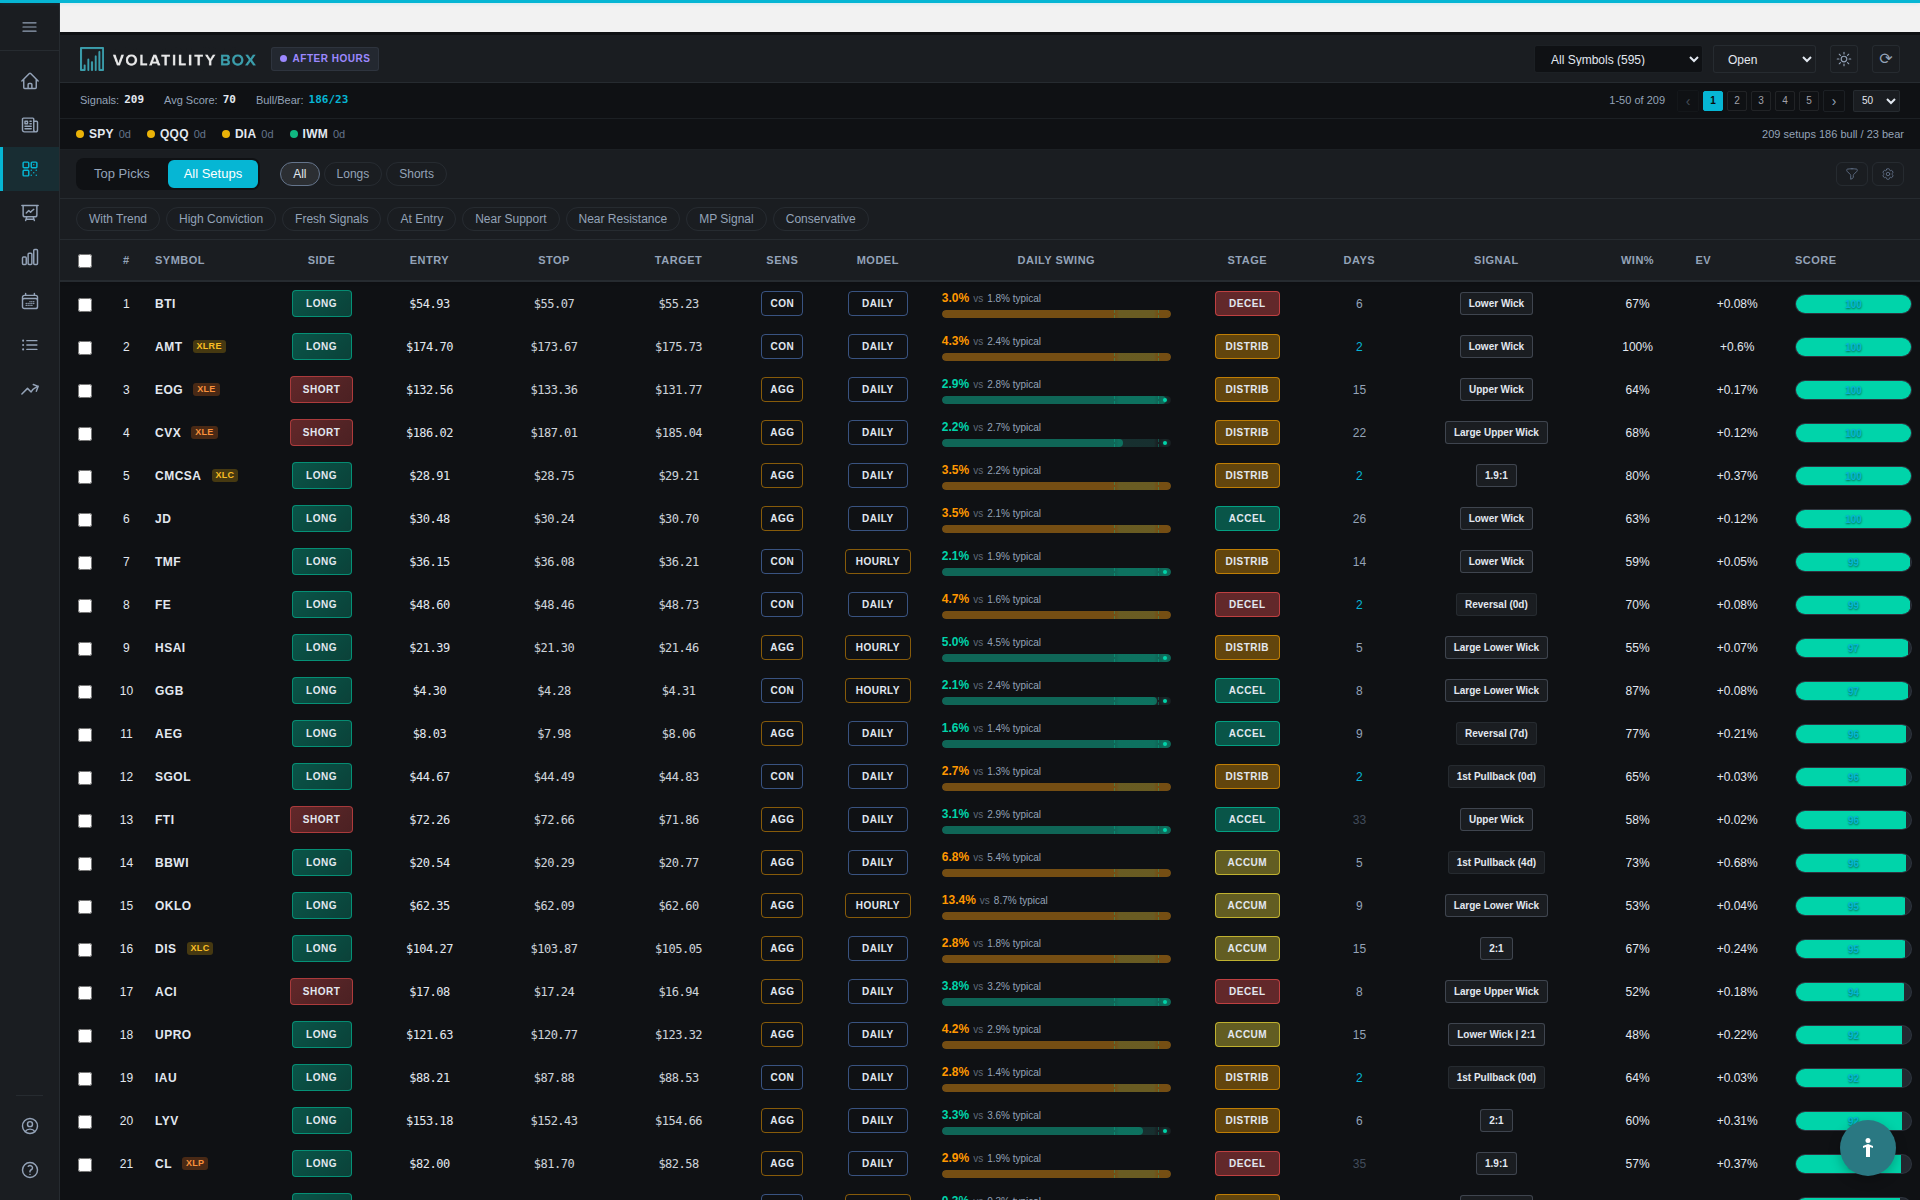
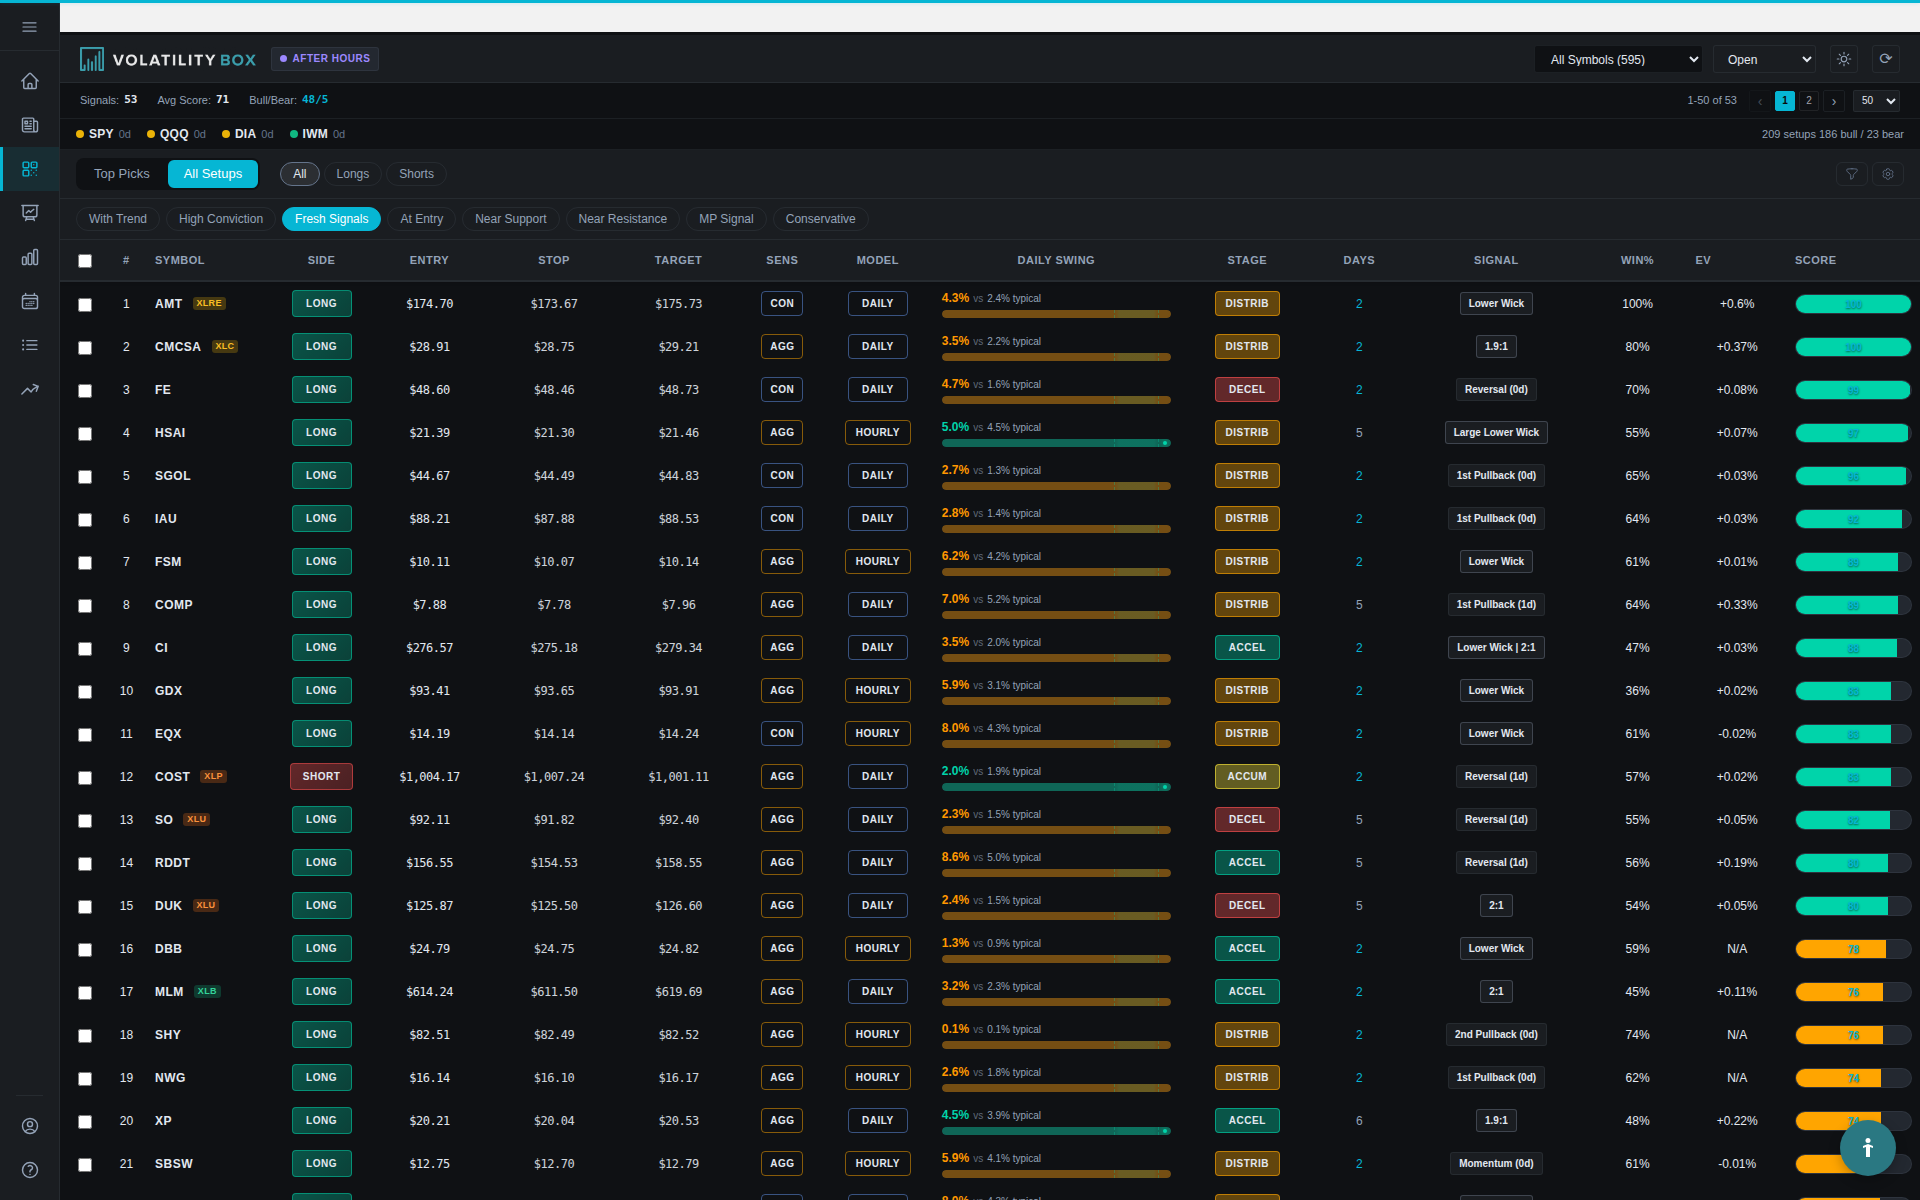
Used well, Market Pulse is the difference between trading every breach blindly and trading only the breaches where the regime is on your side. On the Today page it sorts the whole market into stages and tells you which way to lean; on the Scanner it tags every setup so you can filter to the ones aligned with the trend.
The Four Market Pulse Stages
Every symbol sits in one of four stages. Two carry a long lean and two carry a short lean. This is the core read, the stage tells you the direction the regime favors before you ever look at an individual breach.
Accumulation: long lean (base building)
Accumulation is a base forming after a decline or a pause: price is building support, momentum is turning up but isn’t fully established yet. The lean is long. These are early-trend longs, you’re getting in before the move is obvious, which means more room to the upside but also more patience required while the base completes. On the Today page, “SPY is in accumulation, day 5” means the broad market is building a base and you read the day count to see how mature that base is.
Example: a name has stopped making new lows, is carving higher lows, and a VB long breach fires as price pulls into the orange cloud. With the stage in accumulation, the breach is a with-trend long at the start of a potential new uptrend.
Acceleration: long lean (trend established and pushing)
Acceleration is the strong, established uptrend: clean higher highs and higher lows, momentum stacked in the trend direction, shallow pullbacks. The lean is long, and this is the highest-quality environment for long breaches. A VB long that fires when price dips into the orange cloud during acceleration is a textbook with-trend pullback, you’re buying a discount in a proven uptrend.
Example: a name has trended up for two weeks with only minor pullbacks. A VB long breach fires at the pullback into the lower cloud while the stage reads acceleration. This is the cleanest long the system offers.
Distribution: short lean (topping)
Distribution is the mirror of accumulation: a top forming after an advance, momentum rolling over, the uptrend losing its grip. The lean is short. These are early-trend shorts, taken as the prior uptrend breaks down. A VB short breach into the green (upper) cloud during distribution is a with-trend short at the start of a potential decline.
Deceleration: short lean (downtrend intact)
Deceleration is the established downtrend: lower highs and lower lows, momentum stacked to the downside. The lean is short, and you sell rallies, a VB short breach into the green cloud during deceleration is the textbook with-trend short, fading a bounce in a proven downtrend.
The Counter-Trend Clue: Distance from the Market Pulse Line
Because the Volatility Box is a counter-trend model, the stage works together with how far price has stretched from its Market Pulse line. The farther price sits from that line, the higher the odds of a reversal back toward it, which is exactly the snap-back a breach into the cloud is built to catch. A breach that fires when price is stretched well away from the line is a stronger counter-trend read than one that fires close to it. Pair this with the stage: a stretched pullback into the orange cloud during acceleration is a high-odds with-trend long; a stretched push into the green cloud during deceleration is a high-odds with-trend short.
Where to Focus: Routing Longs and Shorts
On the Today page, the model also sorts the eleven sectors into four “where to focus” buckets. These map the stage logic onto sectors so you know where to hunt each direction:
- Leading: fresh strength. This is where your best long setups live.
- Established: a trend already working. Buy pullbacks here rather than chasing the breakout.
- Weakening: fresh deterioration. This is where long-and-short traders find the best short setups.
- Deceleration: a downtrend still intact. Sell rallies here.
The point of these buckets is to keep you from buying something strong inside a group that’s quietly breaking down, or shorting weakness inside a group that’s turning up. Focus your longs in the leading and positive sectors and your shorts in the weakening ones.
Market Pulse Signal Types
Beyond the stage, Market Pulse tags where in the trend cycle a breach sits. The Scanner surfaces three primary types, Trend Reversal (TR), First Pullback (FP), and Momentum Entry (ME), while Second Pullback (SP) and Trend Continuation (TC) are secondary alert-only flags. Knowing the type lets you prioritize the highest-probability entries even within the same stage.
FP: First Pullback
FP is the first retracement in a newly established or confirmed trend, price has pulled back to a key moving average and is resuming in the trend direction. This is the classic “buy the dip” in an uptrend or “sell the rip” in a downtrend, and it’s the entry professional traders prioritize. The pullback is lower-risk than chasing new highs because your stop sits just beyond the pullback extreme, giving strong risk-reward. FP paired with an Acceleration stage produces some of the strongest setups in the system.
Example: a name breaks out, rallies, then pulls back to its near-term moving average over two days. A VB long breach fires right at that moving average with FP type while the stage reads acceleration, the first test of support in a fresh uptrend, resuming from an optimal entry.
ME: Momentum Entry
ME is a with-trend momentum continuation: the breach coincides with accelerating movement rather than a pullback, getting you into a name while the trend is actively expanding. It works because momentum tends to persist once established. The trade-off is entry timing, because you’re entering mid-move rather than on a pullback discount, your stop placement has to absorb the extra distance. ME is one of the three primary scanner types and pairs well with Acceleration and Deceleration stages and WITH-trend alignment.
Example: a name in a clear uptrend rallies hard on heavy volume. A VB long breach fires with ME type, capturing the with-trend push as the move expands. Valid because you’re joining strength, just manage it actively since you’re entering during an active push.
TR: Trend Reversal
TR is the breach showing early signs of a trend turning, a downtrend attempting to become an uptrend or vice versa. These are the riskiest because you’re timing the exact turning point, and most attempted reversals fail as the trend simply resumes. TR suits advanced traders with reversal expertise. Trade it only with strong confluence and tight stops, expect a lower hit rate, and aim for larger winners on the ones that work. TR is the natural type for the rare AGAINST-trend setup, and it fits best when a stage is rolling from one lean to the other (acceleration losing steam into distribution, or deceleration basing into accumulation).
Example: a name in a downtrend reaches key support and prints a strong rejection candle. A VB long breach fires the next day with TR type. The support and rejection give it some validity, but the downtrend is established, so you’d want strong volume confirmation and tight risk before trusting the turn.
SP: Second Pullback (alert-only)
SP is the second pullback within an established trend, retracing to a key moving average after the first pullback held and the trend resumed. It extends the with-trend pullback idea past the first retracement. SP is a secondary alert-only flag, solid but generally a notch below the first pullback since the trend has already been tested once. Click through to the Charts view to confirm the structure visually before trusting it.
TC: Trend Continuation (alert-only)
TC is ongoing momentum in an established trend without a pullback, continuation through only minor consolidations. It’s a secondary alert-only flag, useful in very strong trends where pullbacks are shallow, but a notch below an equivalent FP because you’re buying higher rather than at a pullback discount. Take profits a bit earlier and treat it as a follow-on when no FP is available.
Trend Alignment: WITH vs AGAINST
Market Pulse evaluates whether the breach direction aligns with or opposes the stage’s lean, which gives you the WITH versus AGAINST read. This single filter moves your odds more than almost anything else, because it decides whether you’re trading with the path of least resistance or fighting it.
WITH Trend Alignment
WITH means the breach direction matches the stage lean, a long breach during accumulation or acceleration, or a short breach during distribution or deceleration. You’re trading the snap-back the model is built to catch and doing it in the direction the regime favors. WITH-trend breaches win materially more often than AGAINST ones when everything else is equal, and that edge compounds over a sample. The large majority of your trades should be WITH-trend.
Example: a name is in acceleration, making higher highs and higher lows. A VB long breach fires WITH alignment as price pulls into the orange cloud at a moving-average support, you’re buying a pullback in the direction of the established uptrend, the high-quality case.
AGAINST Trend Alignment
AGAINST means the breach opposes the stage lean, a long breach during deceleration trying to catch a bottom, or a short breach during acceleration fading a rally. This fights momentum and bets the trend is exhausting. Most counter-trend attempts fail because trends persist longer than seems rational, so AGAINST-trend trading is unprofitable for most traders. Only consider it when the type is TR, the stage is rolling over (distribution after acceleration, or accumulation after deceleration), the counter-trend stretch is large, and you accept tight stops and a lower hit rate. If you don’t have specific reversal expertise, skip AGAINST setups entirely and trade only WITH-trend.
How Market Pulse Shapes Setup Quality
The stage, type, alignment, and freshness of a breach all feed how strong the setup grades out. WITH-trend breaches in a clean acceleration or deceleration stage grade highest; AGAINST-trend breaches grade lowest. First-pullback and momentum types grade above hard-to-time reversals. Fresh breaches grade above stale ones, because once price has run from the breach level, the entry and the volatility-sized stop have already deteriorated. The exact weighting is proprietary, but the intent is simple: the system favors with-trend, well-timed, fresh entries over speculative reversals.
Example: two long breaches look similar on paper, but one is FP, WITH-trend, in acceleration, while the other is TR, AGAINST-trend, in deceleration. Take the first. Same trigger, far better context, the stage and alignment are doing the work.
Real-World Setups
The clean one (Acceleration, FP, WITH)
A name has trended up for two weeks in acceleration. Price pulls back into the orange cloud at its near-term moving average and a VB long breach fires, FP type, WITH alignment. The clouds are well separated (not compressed), and the pullback is a healthy distance from the Market Pulse line. This is the setup to hunt and size appropriately: with-trend, optimal entry, volatility-sized stop just outside the cloud, target back toward the highs.
The marginal one (Accumulation, ME, WITH)
A name is early in an accumulation base, the trend isn’t fully established. A VB long breach fires with ME type, WITH the budding long lean. It’s tradeable because you’re with the lean and entering early, but the base isn’t confirmed, so trade smaller, keep the stop tight outside the cloud, and take profits a bit quicker. Reasonable, but not the conviction of an acceleration FP.
The skip (Deceleration, TR, AGAINST)
A name is in deceleration, lower highs and lower lows. A VB long breach fires trying to call a bottom, TR type, AGAINST the short lean. This is fighting an established downtrend on the hardest-to-time entry. Skip it unless you have overwhelming reversal confirmation, strong volume, a key support test, and a stage genuinely starting to roll from deceleration toward accumulation. Most of the time this one stops out as the downtrend simply resumes.
Key Takeaways
- The four stages set the lean: Accumulation and Acceleration lean long; Distribution and Deceleration lean short. Read the stage first, it’s the regime your trade lives in.
- Because the Box is counter-trend, the farther price is stretched from the Market Pulse line, the higher the reversal odds, which is the snap-back a breach is built to catch.
- The Today page routes you with the where-to-focus buckets: longs in Leading and Established sectors, shorts in Weakening and Deceleration.
- Signal types rank the entry: FP and ME are the primary with-trend entries, TR is the hard-to-time reversal, and SP and TC are alert-only follow-ons.
- WITH-trend alignment is the highest-impact filter. Trade the large majority of your breaches WITH the stage lean, and only fade it on TR setups when the stage is rolling over and the stretch is large.
- Stage, type, alignment, and freshness together decide setup quality, with-trend, well-timed, fresh breaches grade highest.
Related
Was this article helpful?
Still need help?
Can't find what you're looking for? Our support team is here to help.
Contact Support