Daily and weekly trading workflows
The platform is built around a single funnel: set a market bias on the Today page, overlay your watchlist, work the Scanner top down, then confirm on the chart. Run it in that order and each step narrows the field to the few trades worth taking.
Watch: Part 10 of the Volatility Box onboarding series.
The whole edge in one idea
Everything comes back to one idea: volatility is predictable enough to trade. The models give the levels where price tends to react. A breach of those levels is the signal that something is setting up. The four confluence layers, trend via Market Pulse, the Edge Signal, the Keltner 3.0 channel wedges, and the 3/8 EMA momentum cross, tell you how much to trust the move. That is the edge.
A routine exists to let the platform do the watching, so decisions come from data rather than willpower. The funnel and your alerts surface the trades that matter; on many days the work collapses to checking a short list of setups on your phone. Some days that list is empty, and that is a result, not a failure.

The daily funnel
Run these four steps top to bottom. Each one narrows the field.
- Today page: set the bias. Before any single stock, read the Market Pulse stage and the 10-day market breadth. Accumulation or Acceleration leans long; Distribution or Deceleration leans short. This one read answers the day’s first question: are you trading with the trend or against it?
- Watchlist: overlay your names. A tight watchlist is the fastest way to cut noise so you do not start from a blank screen. It focuses attention on the names you trade and the breaches happening in them, hourly, daily, or both. Paired with alerts, those setups come to your phone wherever you are.
- Scanner: work top down. The Scanner ranks every name by edge, strongest at the top, so there is little filtering to do. Start at the top and work down, adding filters to match your style. This is where most of the session goes when volatility is in play.
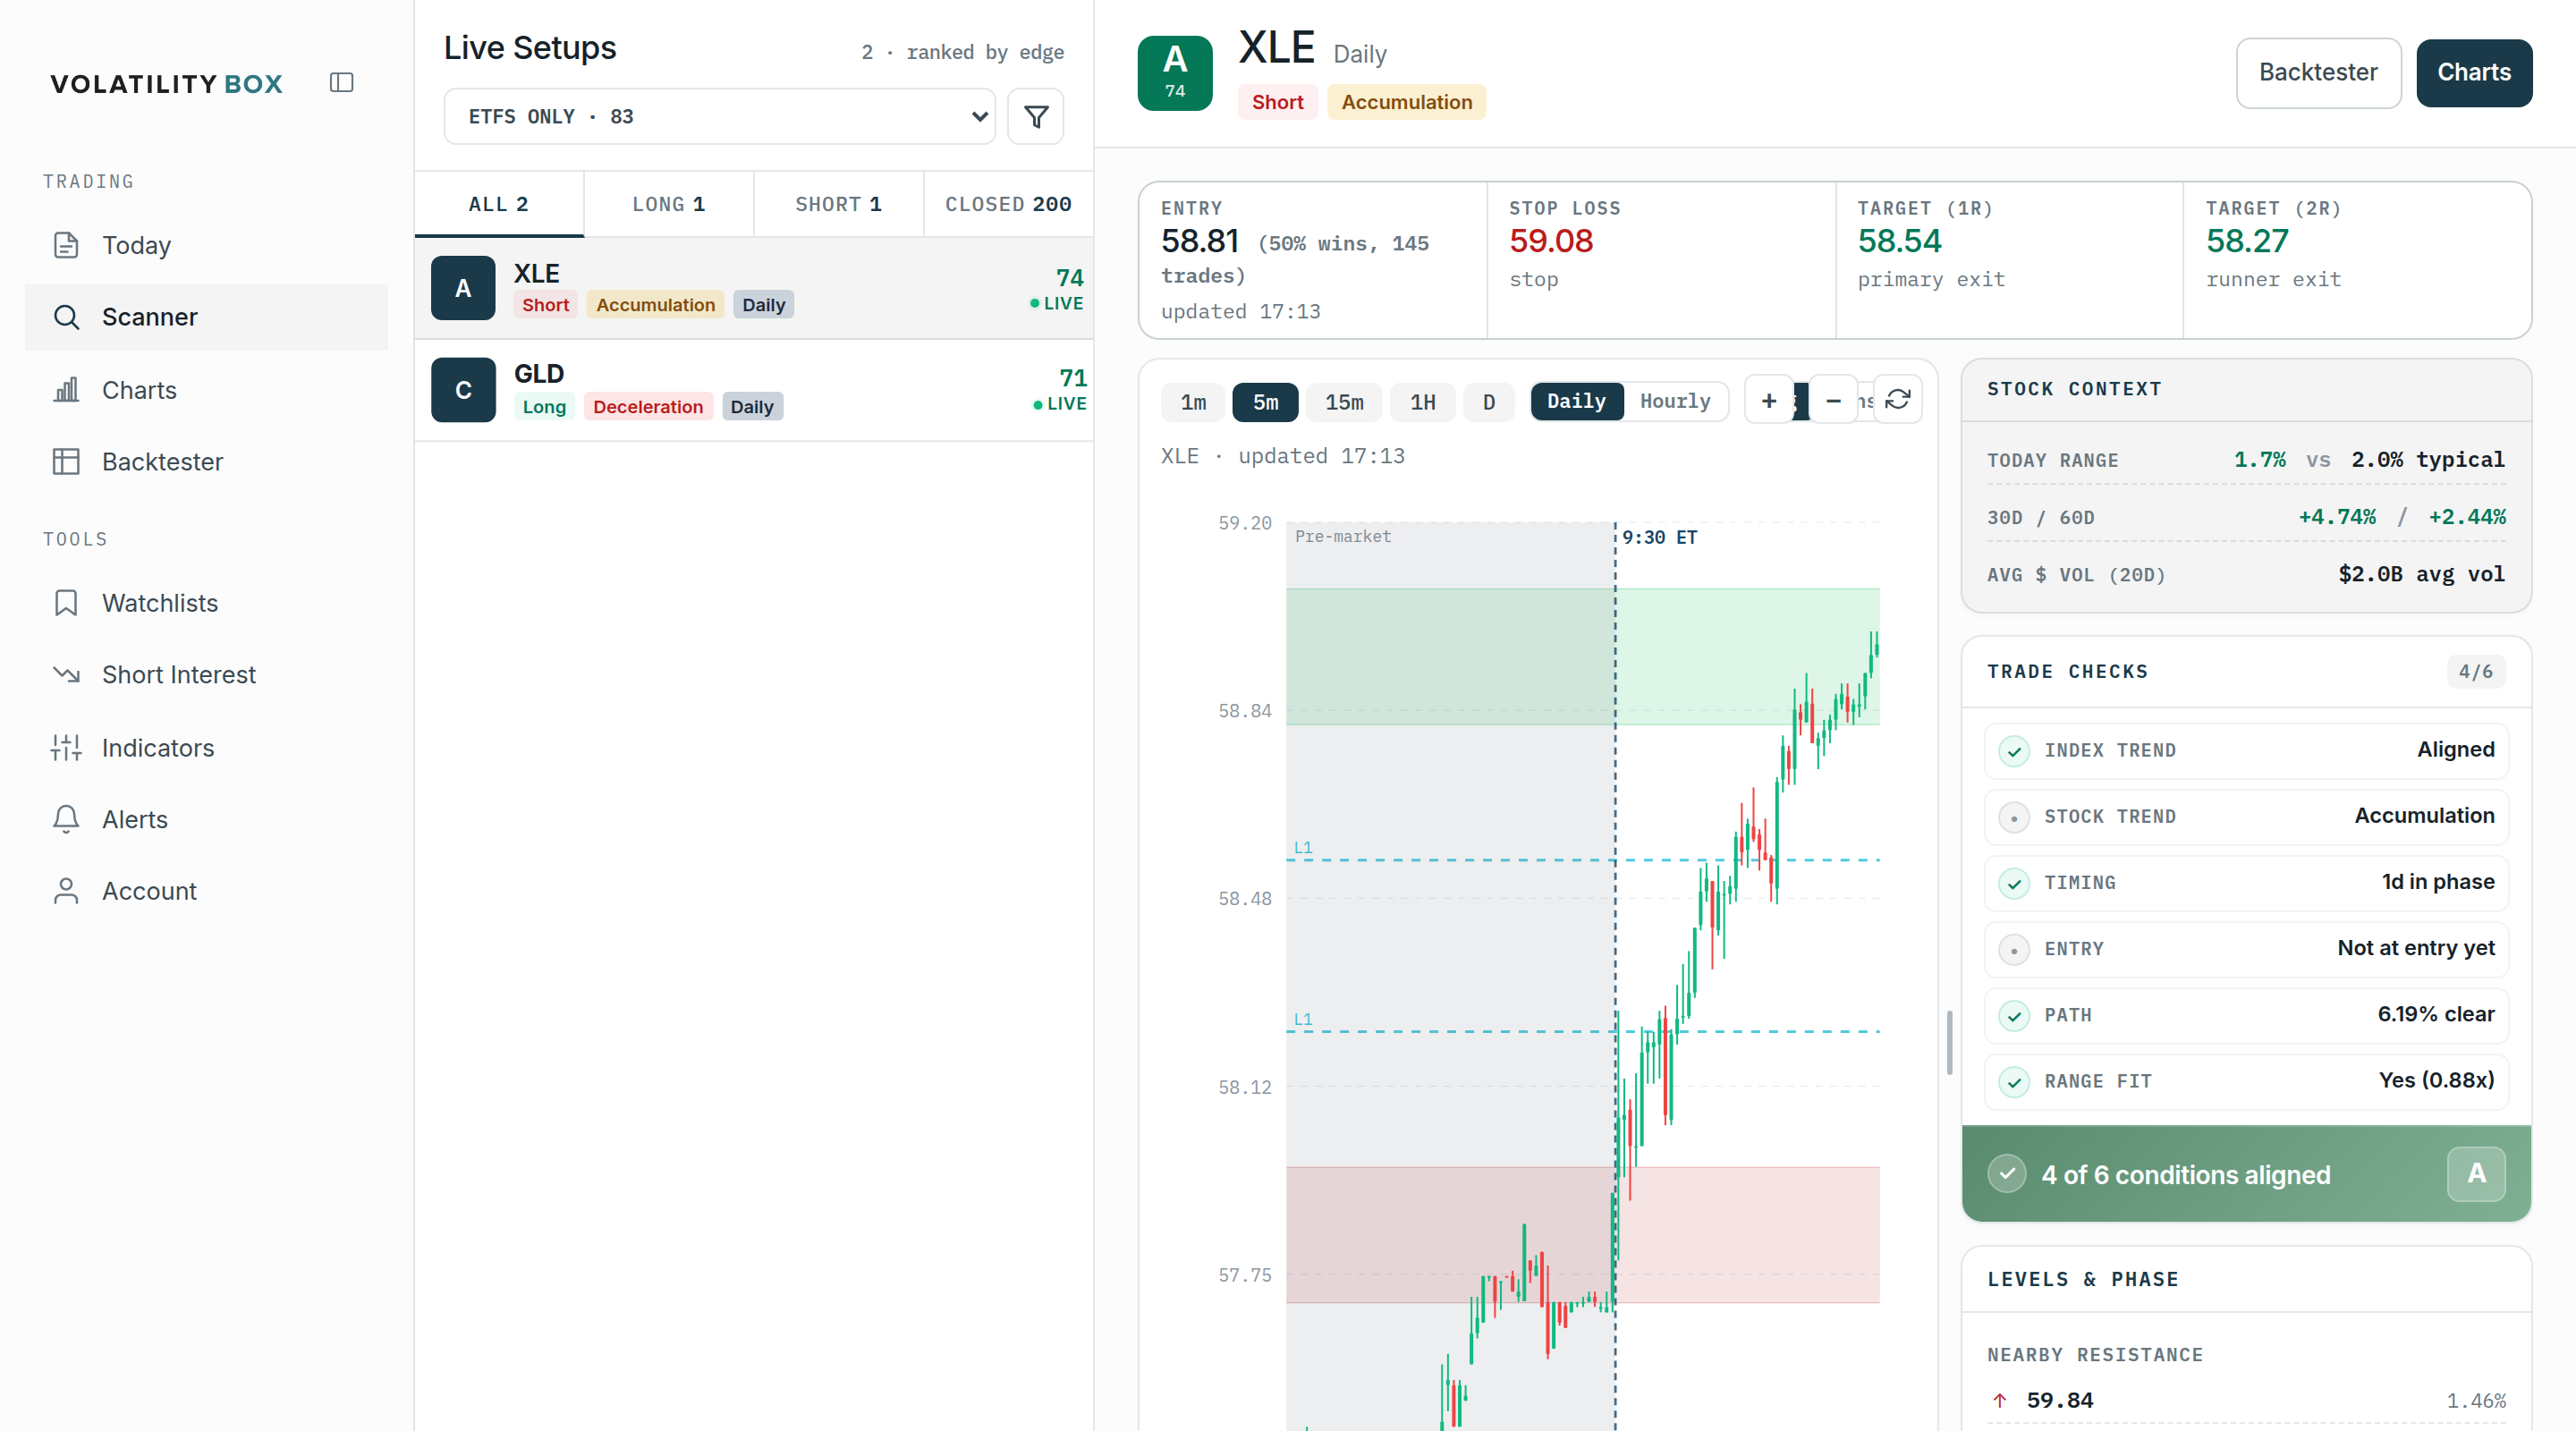
- Chart and checks: decide. When a setup looks worth taking, the chart loads on the right with the models plotted, plus support and resistance levels and the checklist, so you can confirm the trade before committing.
That is the whole process: set the bias on the Today page, then spend most of the time applying it on the Scanner.
Apply the bias on the Scanner
The bias from the Today page decides how to read the Scanner. In a long-leaning stage, prioritize long signals and treat shorts with more skepticism; in a short-leaning stage, do the reverse. Because the Scanner is already sorted by edge, the strongest setups that agree with the bias sit near the top. Start there.
The signal types on the Scanner are TR for Trend Reversal, FP for First Pullback, and ME for Momentum Entry. Each row carries a 0 to 100 edge score with a letter grade, so a glance tells you how strong the read is relative to the rest of the board.
Let alerts bring the setups to you
The watchlist plus alerts is what makes the routine work away from the desk. Set alerts on the names you trade, and the breaches in those names reach your phone as they happen. Instead of scanning all day, you act on the handful of setups that fire in the names you already chose. This is the difference between reacting to noise and acting on a short, filtered list.
The weekly side: research on the weekend
Market hours are for execution. The heavier research belongs to the weekend, when nothing is moving. Use the backtester to study which names and models carry an edge, so that during the week you are applying conclusions rather than forming them. Refresh the ThinkorSwim studies as part of the weekly routine: confirm the upcoming week’s range and import the new bundle. See Weekly indicator updates.
Conservative models are favored around earnings and FOMC and in high-volatility conditions, so note scheduled events for the week and lean conservative into them.
When not to trade
The funnel narrows to nothing on some days, and that is the correct outcome. If the clouds are compressed or inverted, volatility is too high to read cleanly: sit out, or trade only with the prevailing pressure. An empty short list is the platform telling you there is no edge right now, which is worth as much as a setup.
Related
Was this article helpful?
Still need help?
Can't find what you're looking for? Our support team is here to help.
Contact Support