Running backtests
This guide covers running a backtest from the control panel, reading the three result panels, and the three comparison tests that turn a single score into an actual trading decision.

Watch: Part 7 of the Volatility Box onboarding series.
Run a backtest
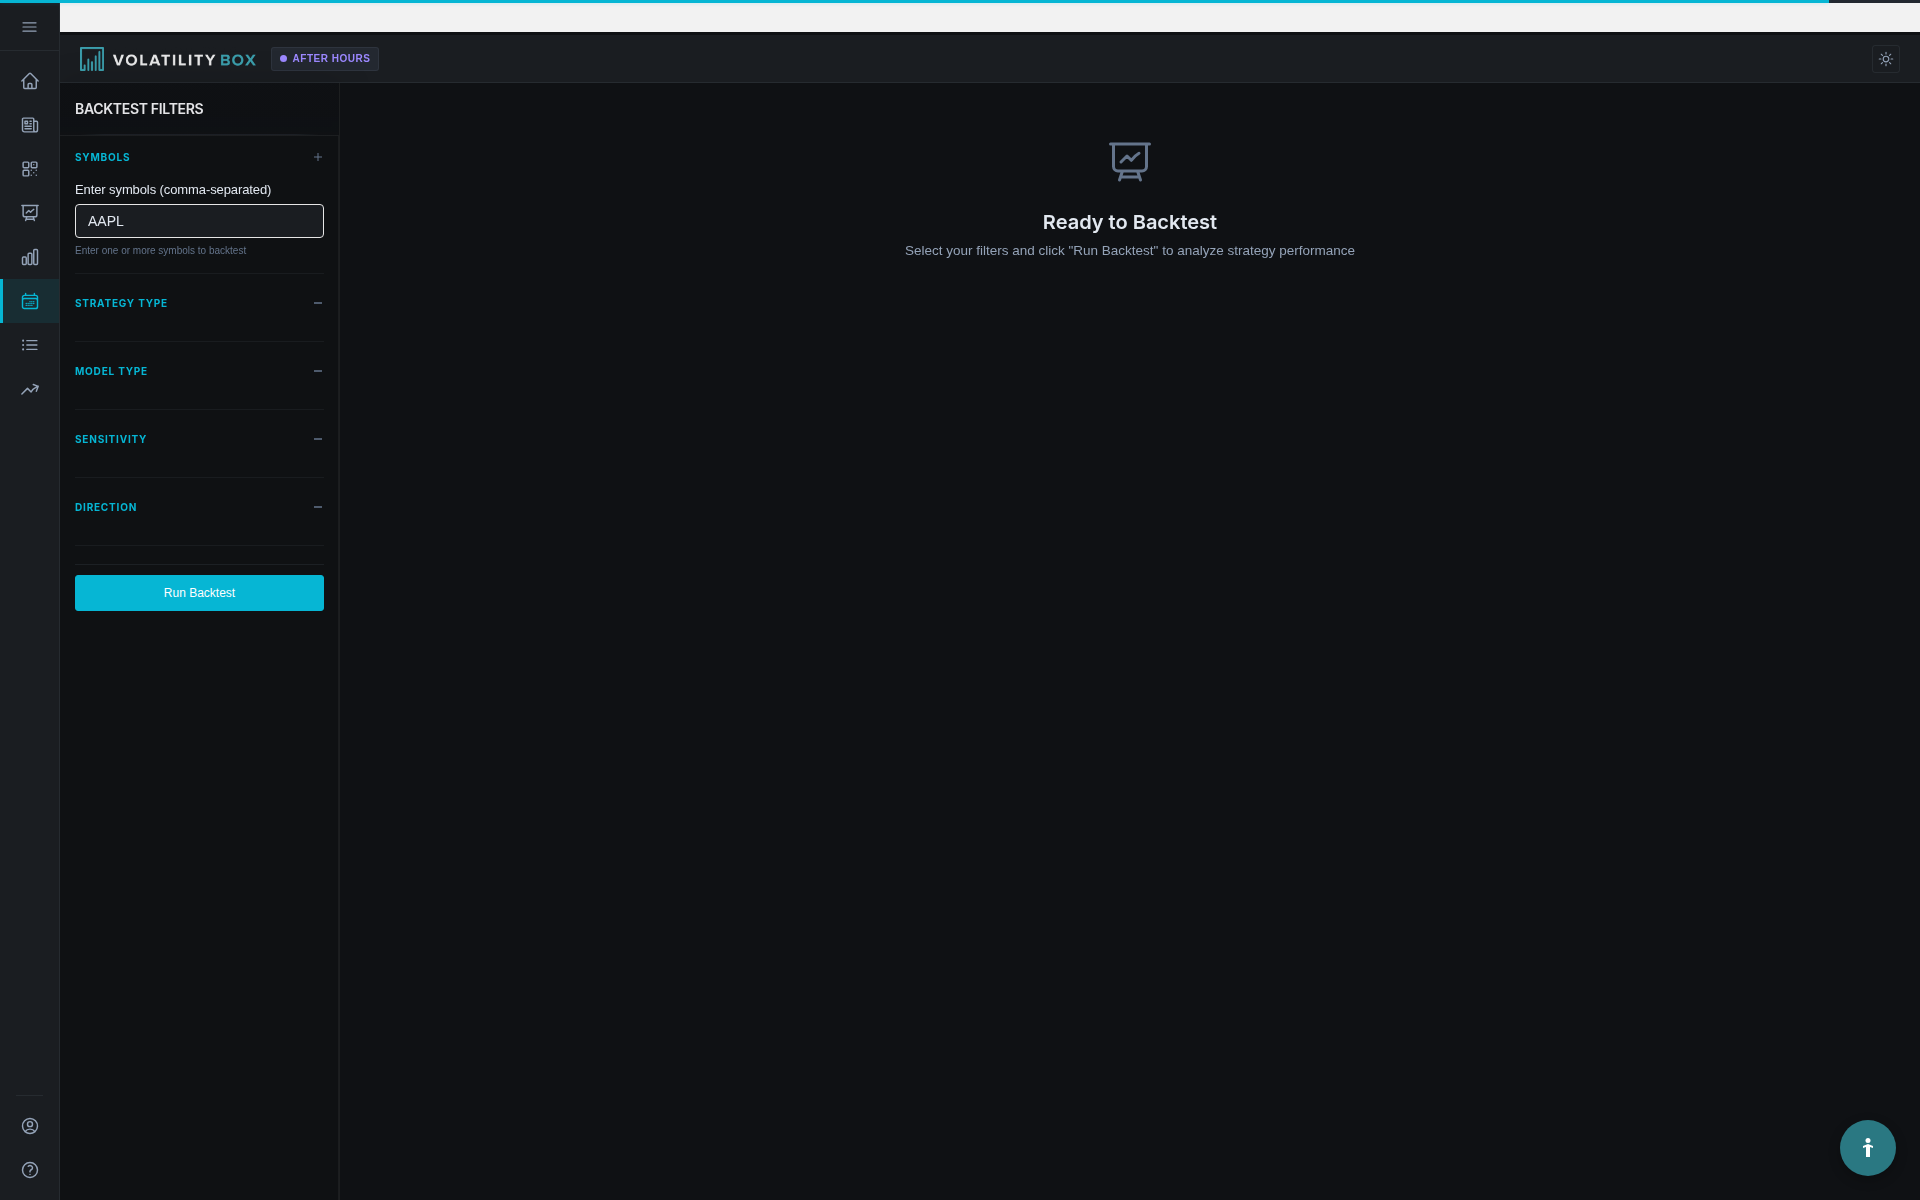
Everything starts on the left side of the backtester, the control panel. Set your inputs there, then run.
- Enter a symbol. Any stock or ETF the platform supports can be tested.
- Pick the model. Choose the daily models only or the hourly models only.
- Pick the sensitivity. Choose aggressive only, conservative only, or both.
- Pick the direction. Choose long, short, or both.
- Set the date range if you want to test a specific market regime. Otherwise leave it on the default.
- Click Run backtest.
To compare models first, you can select all and look at everything together. The clues come from granularity, so once you understand the page you will set one model and one sensitivity at a time and change a single input between runs. The date range is the tool for asking how a model held up during different conditions; leave it alone for the standard full-history view.
Read the three result panels
When the backtest runs, three things fill in on the right side.
Headline numbers, at the top. The two to anchor on are expectancy and profit factor. A positive expectancy means the setup made money per trade on average. A profit factor above one means more dollars were won than lost. Both positive is the combination worth trading, and the platform colors them green as a quick cue. Win rate appears here too but is secondary: a setup can win under half its trades and still pay if the winners are large enough.
Cumulative profit and loss curve, in the middle. You want a steady climb up toward the right. A curve that bleeds lower is the picture of a losing combination.
Trade log, below the curve. Every time the setup fired over the history, with entry, exit, and result. This is the raw record behind the headline numbers.
The three clues
Running a backtest once gives you a quick read on how effective a model is. The information becomes far more useful when you run a name two ways and compare. The readings below are real examples from our historical backtests, used to show what each comparison reveals. They are not forecasts. Run each name yourself for its current numbers.
Clue 1: aggressive vs conservative, where the edge lives
Pull up Coinbase on the daily models with aggressive sensitivity and the result is ugly: roughly a 41.9% win rate, a negative expectancy near 0.68, a profit factor of about 0.67, and an equity curve that bleeds lower. Most people would throw the name out. Do not. Change one thing, flip aggressive to conservative with everything else the same, and the win rate moves to nearly 60%, expectancy turns positive, and the profit factor climbs to about 1.54. Run UnitedHealth the same way and the shift is sharper still, a daily aggressive profit factor near 0.66 flipping to about 2.56 on the conservative.
The clue: when price first tags the aggressive Volatility Box models, that is not the entry, it is the first alert. The edge sits somewhere between the aggressive and the conservative. So when price hits the aggressive you start paying attention and hunt the entry with the Edge Signal, but you wait for that entry much closer to the conservative models, if not inside the clouds. The backtest told you where to wait.
Clue 2: aggressive holding as an exit signal
Run the hourly models on Apple and you might see a 55.1% win rate and a profit factor of 1.30. Flip to hourly conservative and the same test falls apart: win rate down to 49.5%, profit factor down to 0.97, now below one. That combination is a clue about risk. As long as price holds the aggressive models, the edge is there and it is fine to stay in for the reversal. The moment price breaks the aggressive models and pushes toward the conservative, history says the move stops paying, because volatility is expanding. If you were long, the break of the aggressive is the cue to exit gracefully. Here the backtest did not find your entry, it gave you a rule for when to leave.
Clue 3: daily vs hourly, which model owns the name
Run a name on the daily, then on the hourly, and compare. Disney on the daily aggressive is excellent, around a 60.9% win rate and a profit factor of 1.61. The same name on the hourly drifts toward mediocre, about 52.1% win rate with the profit factor barely over one. That tells you Disney is a daily name: its edge is the slow multi-day move, not the fast intraday chop the hourly would catch, so you wait for the one day the daily models get breached because that move tends to pay better than the smaller trades in between. Other names are the opposite, dead on the daily but alive on the hourly when volatility kicks in. Use this comparison to decide which model owns each of the names you trade.
Run these three tests on the symbols you care about and rerun them over time. You will start to see how volatility on a name is shifting, which is information in itself.
Comparing several symbols at once
Enter several tickers separated by commas and the platform runs each and lays the results out for comparison. Rank them the same way you read a single result: by expectancy first, with sample size as the tiebreaker when two names are close, then drop the marginal ones. The table below is an illustrative layout showing how the comparison reads. The labels stand in for the numbers a real run would populate, not performance claims.
| Symbol | Win rate | Expectancy | Trades | Profit factor |
|---|---|---|---|---|
| Symbol A | read with expectancy | highest | large | above one |
| Symbol B | read with expectancy | strong | large | above one |
| Symbol C | read with expectancy | marginal | small | near one |
Common questions
Testing several models on one symbol. Run the symbol once for each model and sensitivity, then compare. That is the clue-one and clue-three workflow above.
How often to rerun. Periodically, on the names you trade. Volatility regimes shift, and a combination that tested well can change. Rerunning also shows you how a name is evolving.
Why the numbers are framed as historical. Every figure the backtester reports comes from past model signals over the test window. It describes what happened, not what will happen, and live trading carries costs such as spread and slippage that a historical study does not fully capture.
Related
Was this article helpful?
Still need help?
Can't find what you're looking for? Our support team is here to help.
Contact Support