Scanner Table Guide
What the Scanner table shows
The Scanner lists the live setups where the models currently show a volatility edge, ranked so the strongest surface first. This guide covers what each part of the table shows and how to use the detail panel and filters to get from the full list down to the few setups worth trading.
Watch: Part 6 of the Volatility Box onboarding series.
The edge grade and reading top-down
The list is ranked by edge, strongest at the top. Each setup carries a letter grade (A+, A, B, and down) backed by an edge score on a 0 to 100 scale that summarizes how many of the model’s conditions line up. Reading top-down starts with the strongest setups instead of a blank chart. This is the answer to what is in play today: one ranked, validated read rather than a screen of conflicting indicators. The grade triages the list; opening a row gives the specifics before committing.
What each row shows
- Ticker, with its edge grade and score.
- Direction, Long or Short. The Volatility Box is counter-trend: a Long means price dropped into the lower (orange) cloud and breached the model, not an upside breakout; a Short means price ran up into the upper (green) cloud. Entry sits at the cloud, the stop just outside it, and the target is the reversion.
- Signal type: TR, FP, or ME (see below).
- Market Pulse stage for the symbol: Accumulation or Acceleration (long lean), Distribution or Deceleration (short lean).
- Model that triggered: Daily or Hourly.
- Live status, so the setup reads as active right now.
The tabs above the list switch between All, Long only, Short only, and Closed. Long-only or short-only is one click, which keeps the other side off the screen when the market clearly favors one direction.
Signal types: TR, FP, ME
Each setup is tagged with the type of move that triggered it:
- TR, Trend Reversal. A counter-trend setup: the breach fires against the prevailing trend, fading an extended move back toward the Market Pulse line. The deeper, lower-probability read, with larger winners when it works.
- FP, First Pullback. A with-trend setup: the first retracement inside an established trend, entered in the trend’s direction.
- ME, Momentum Entry. A with-trend setup: an entry that triggers as momentum pushes in the trend’s direction, a continuation rather than a fade.
FP and ME are with-trend; TR is counter-trend. The type sets the expectation for a setup before the chart is opened: a TR is fought against the trend, an FP or ME runs with it.
The detail panel
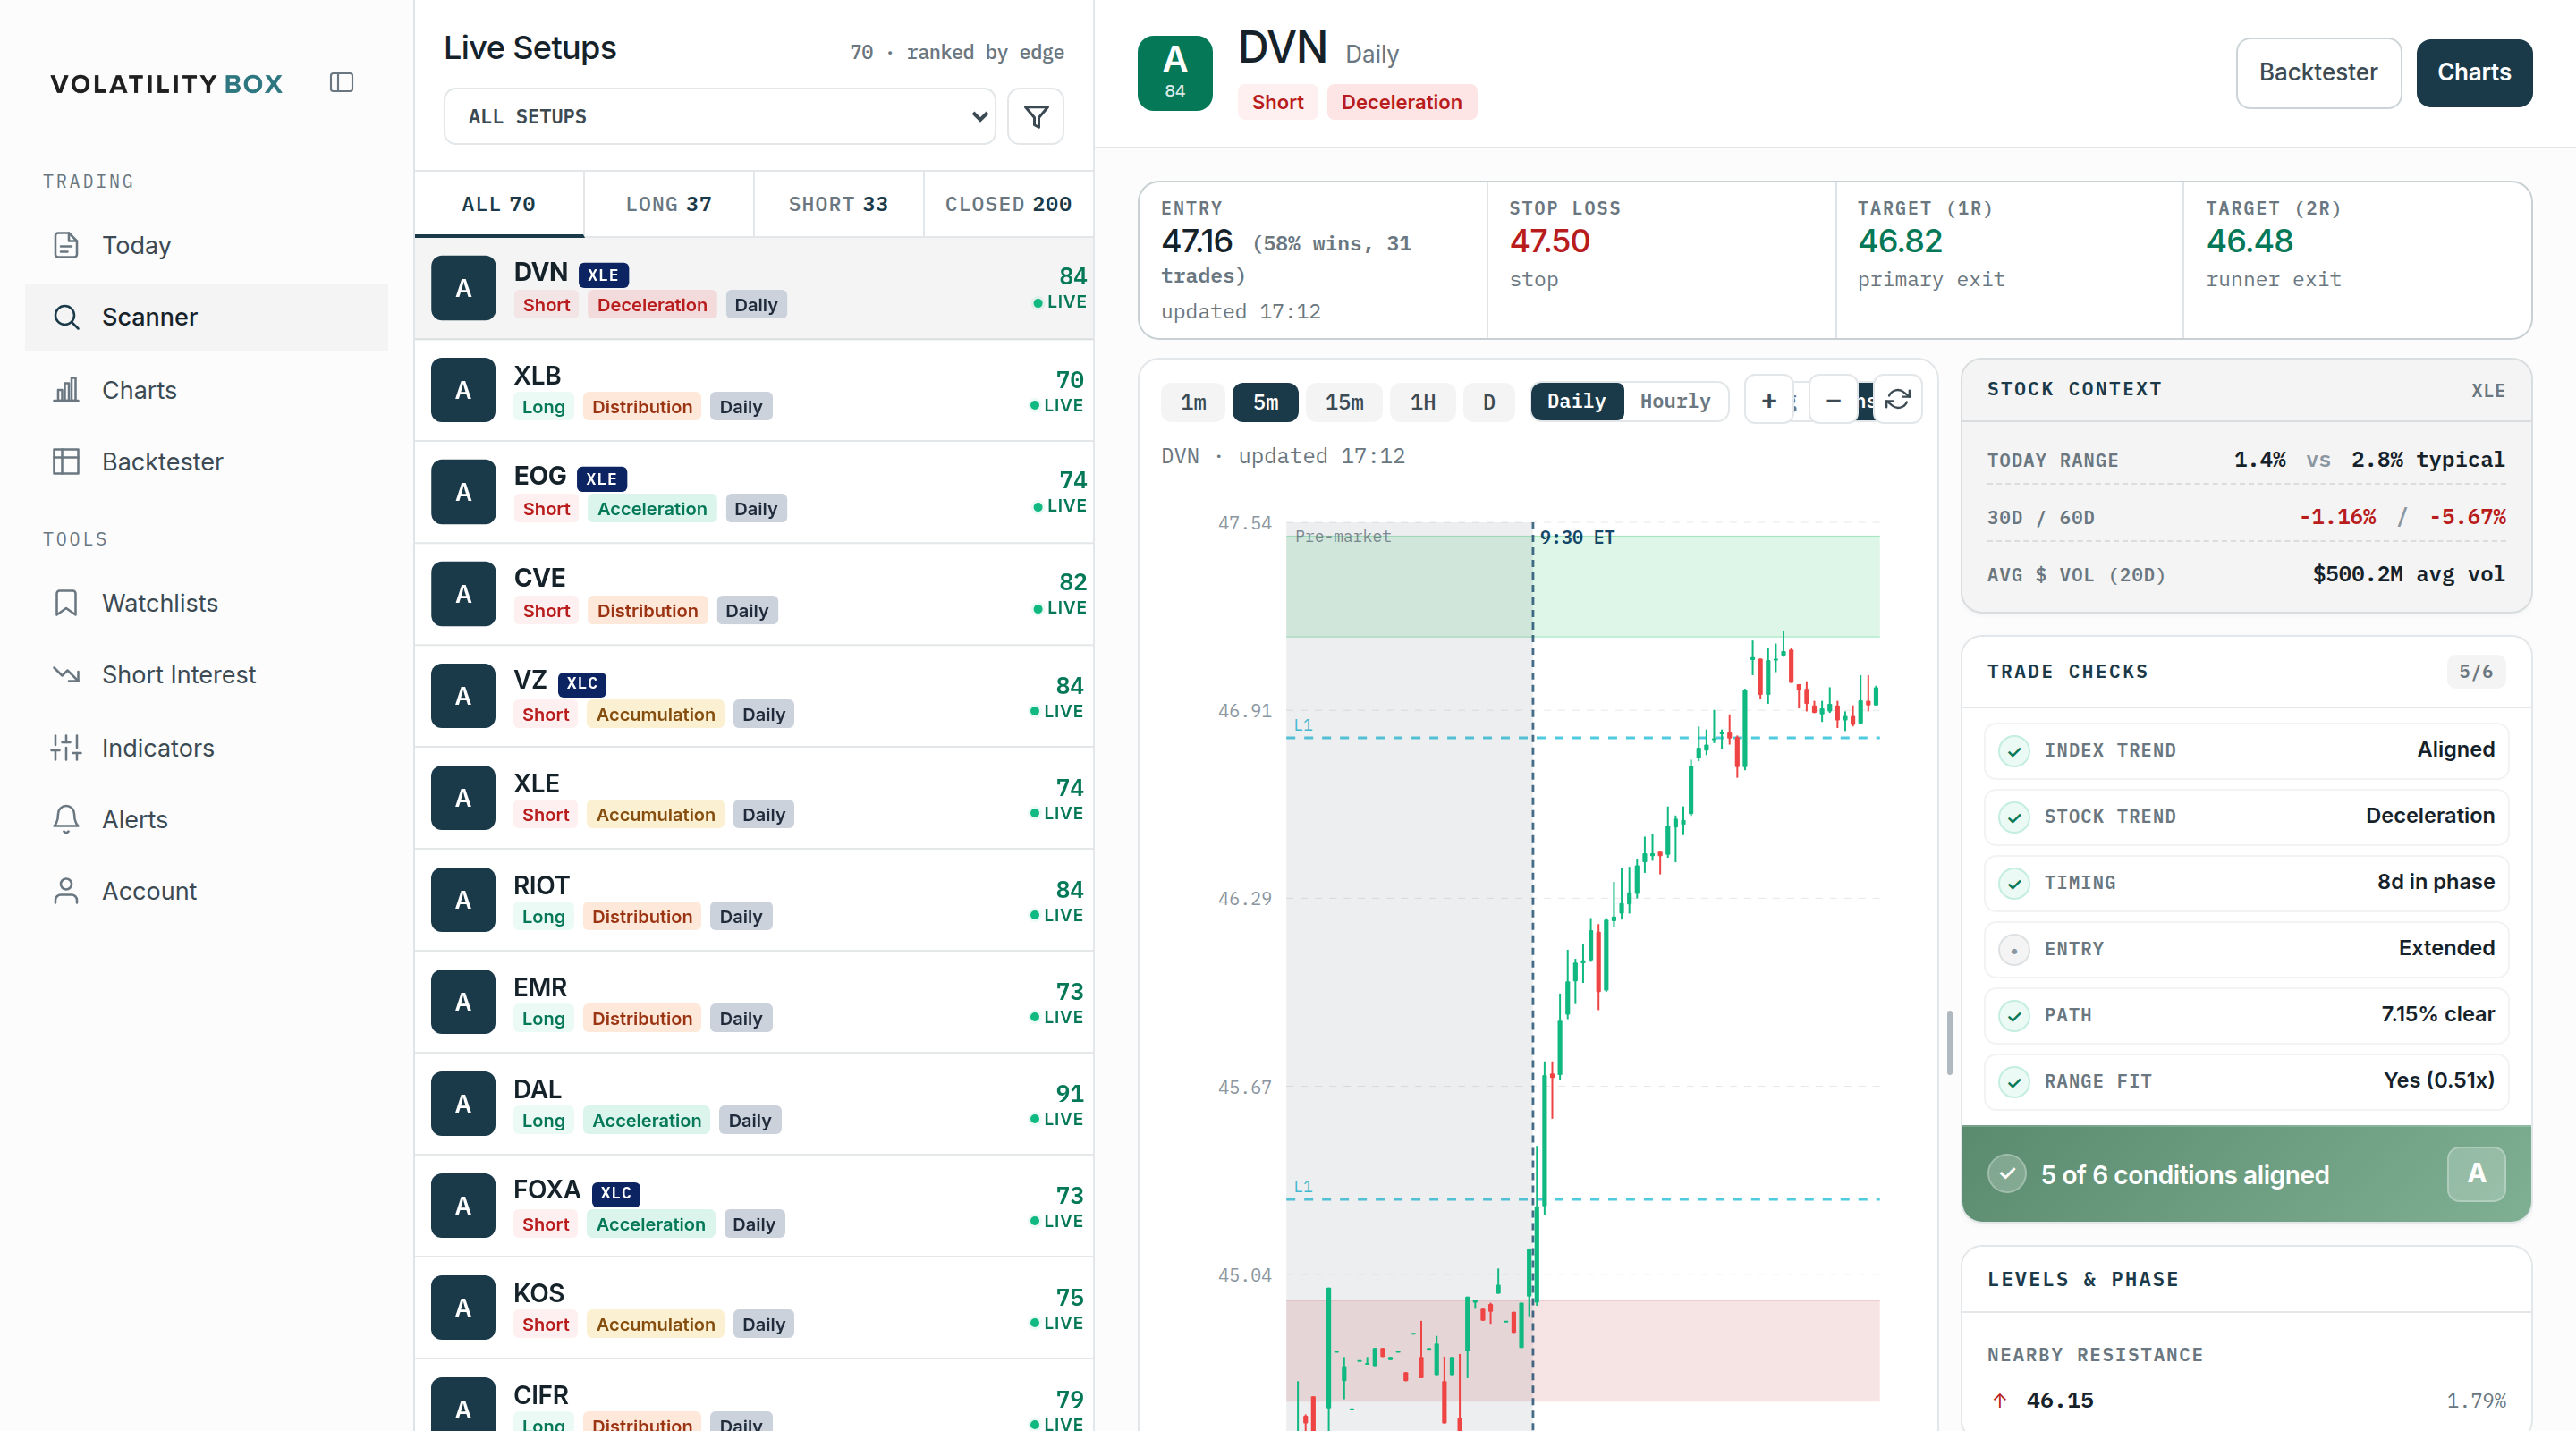
Clicking a row fills the right side with everything needed to decide on the Scanner itself:
- Trade mechanics: entry, stop loss, the first target (1R), and the runner exit (2R). Next to the entry, in parentheses, are the backtest results for that exact setup on that name, for example “40% wins, 321 trades”, a quick read on how it has historically resolved.
- Chart loaded on the model that triggered, at the spot the entry fired, with the same 1m, 5m, 15m, 1h, and daily toggles and the Daily/Hourly and Aggressive/Conservative switches as the Charts page.
- Stock context: today’s range versus typical, 30 and 60 day performance, and average dollar volume.
- Trade checks: the conditions behind the grade (index trend, stock trend, timing, entry, path, range fit) and how many are aligned.
- Levels: the nearby support and resistance.

Filters
- Direction (long, short, or both) and trend (with-trend or counter-trend only).
- Model and sensitivity (Daily/Hourly, Aggressive/Conservative). All is fine on quiet days; when markets move, narrowing to daily or daily-conservative cuts the hourly noise.
- Entry proximity: “entry only” shows setups still near their entry price, filtering out ones already running to target.
- Reward-to-risk skews, and regime/stage, to focus on, for example, only names in Acceleration when fresh uptrends are wanted.
- Watchlist, to show only tracked names.
Combining a few turns a list of a hundred or more into the handful that fit the plan.
The Closed tab
The Closed tab shows setups that already hit target or stopped today. A name that just stopped on the aggressive model is a name where volatility is rising: it breached aggressive, so it is worth watching for the next breach toward the conservative model, which is often the better entry. The Closed tab is how to spot where volatility is picking up before the next setup triggers.
A practical workflow
- Set the bias from the Today page (Market Pulse stage, long or short lean).
- Open the Scanner and apply the matching direction plus any filters for style and timeframe.
- Read top-down from the highest grade.
- Open a row, confirm on the chart and the trade checks, and check the entry is still near its level.
- Size the trade off the stop, which sits outside a volatility-sized cloud, and execute.
Common mistakes
- Reading win rate alone. A high hit rate with small winners and occasional large losses still loses. Read the backtest win rate together with expectancy.
- Trading a stale setup. If the entry fired hours ago and price has moved, confirm on the chart before acting.
- Chasing a setup that has already run. If price is most of the way to target, the reward-to-risk from here is poor; use the entry-only filter.
- Ignoring the signal type. A TR is counter-trend against the stage; an FP or ME is with-trend. Know which one is being taken.
Related
Was this article helpful?
Still need help?
Can't find what you're looking for? Our support team is here to help.
Contact Support