Watchlist bulk generation
The weekly bundle covers about 115 liquid names. For anything outside it, generate a one-off file from a watchlist: pick a list, click Generate, and you get four study files covering every symbol on it. These files are named uniquely, so they import alongside the bundle instead of replacing it.
Watch: Part 9 of the Volatility Box onboarding series.
Before you start
- You have a watchlist saved, or a few symbols in mind.
- You are on the Indicator Generator page.
When to generate a one-off file
Use a one-off file for a symbol the weekly bundle does not include, or to build a focused file of just the names you trade. A name that appears on the Scanner but is not in the bundle is the common case: generate it, import it, and the models plot on that symbol.
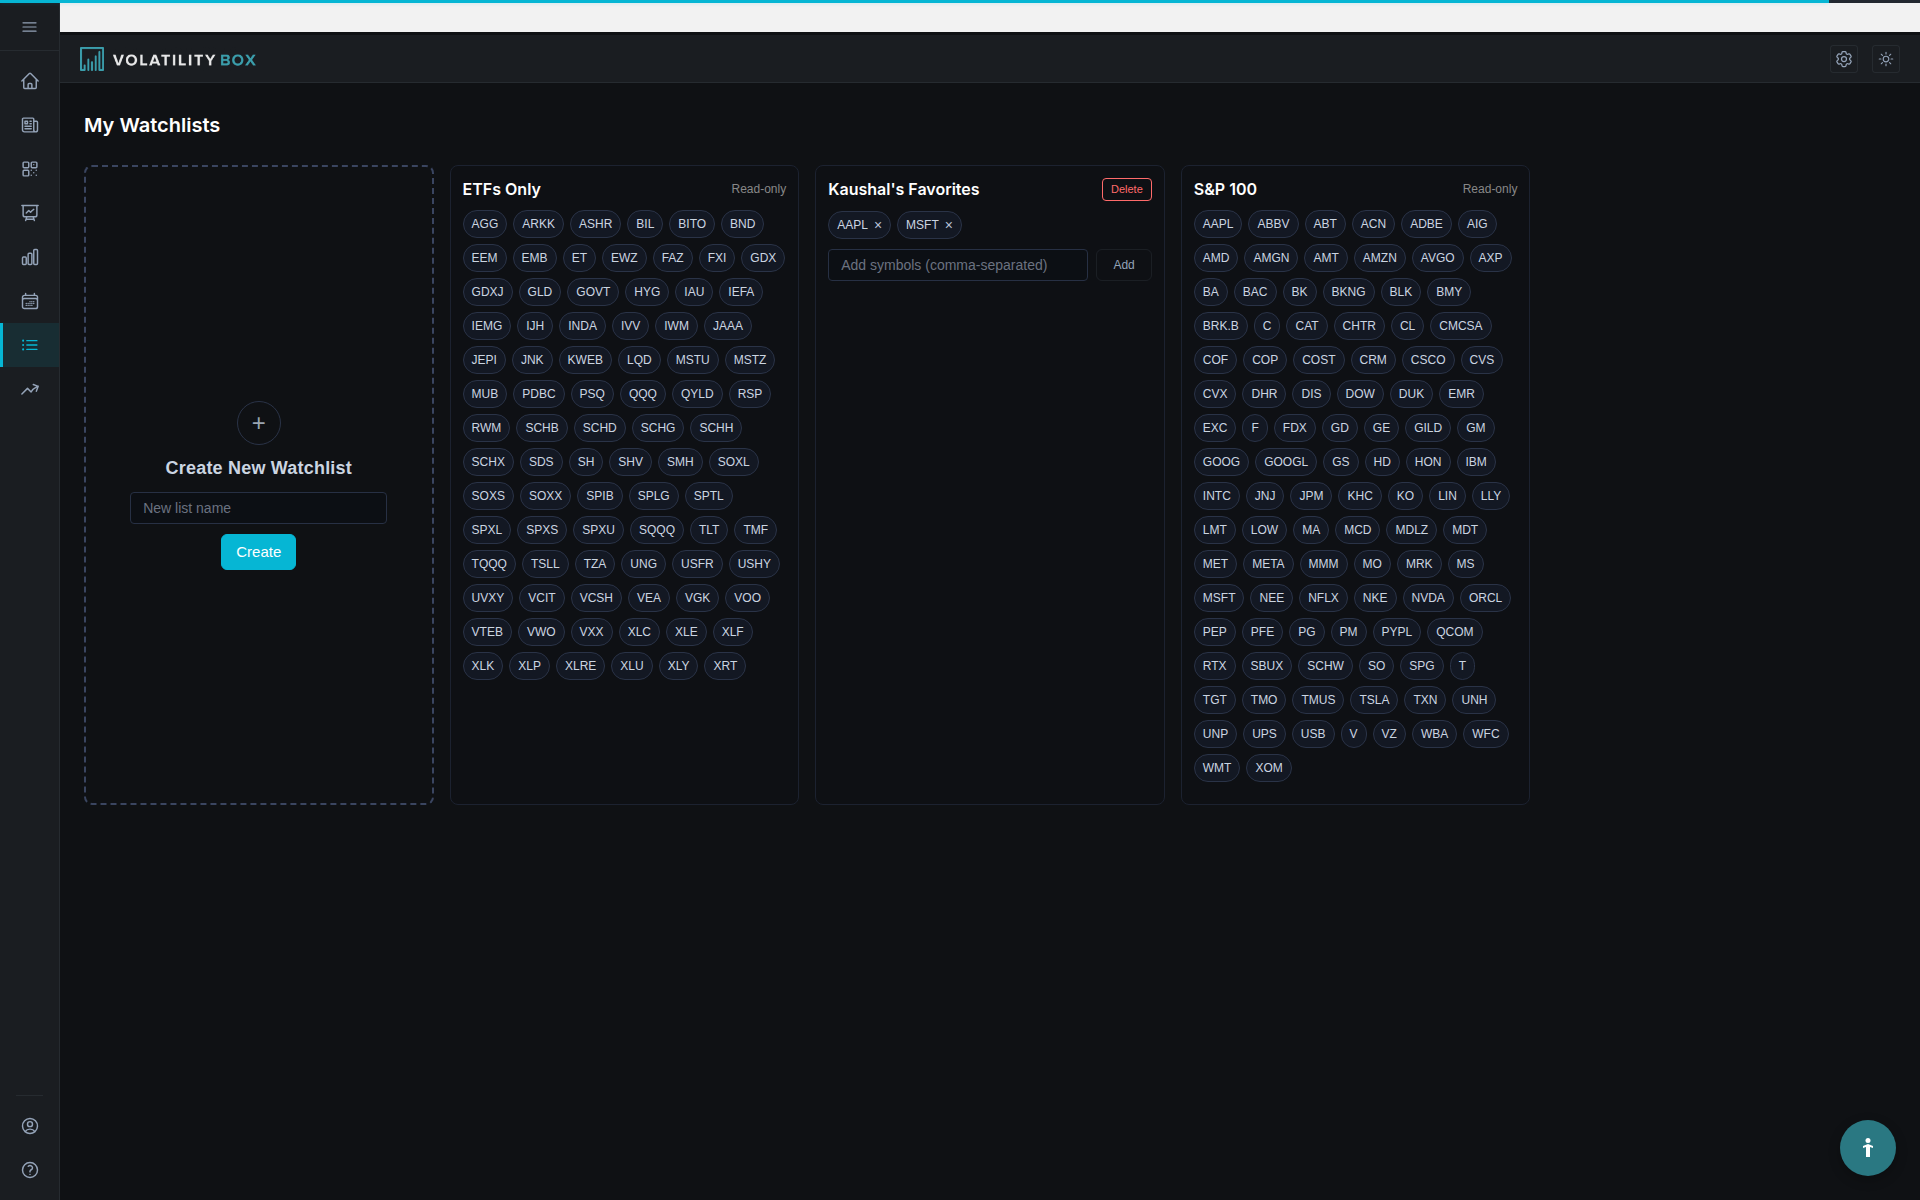
Step 1: Generate from a watchlist
- Open the watchlist dropdown and select a list.
- Click Generate.
- You get four study files covering every symbol on the list, one per model: Hourly aggressive, Hourly conservative, Daily aggressive, Daily conservative.
- Click the download link to save them.
To change the list, add or remove symbols and click Generate again to rebuild the file.
One-off files never clobber the bundle
When you generate a watchlist or one-off file, the files are given slightly unique names. Because the names differ from the weekly bundle files, ThinkorSwim does not replace the bundle when you import them. The one-off sits alongside the default four files.
This means you can keep the weekly bundle imported and add a one-off for a single name without one wiping out the other. Generate it, download it, import it, load the ticker, and the models are there.
Keep custom files near 100 symbols
ThinkorSwim performance stagnates past roughly 100 symbols in a file, which is why the bundle stops around 115. When you build your own file, keep the list near 100 symbols or fewer so it stays responsive. Downloads are unlimited, so split a large universe across several focused files rather than forcing everything into one.
Step 2: Import into ThinkorSwim
- Unzip the downloaded file.
- Click the Studies icon at the top right of ThinkorSwim.
- Click Import, select the
.tsfiles, and click Open.
You can import a one-off file and the four bundle files in the same import. Because the one-off names are unique, the import adds them without touching the bundle.
Verify it worked
Load a symbol from your one-off file and confirm the bands plot. If you load a symbol that is in no imported file, nothing plots. That is expected: a symbol with no study file has nothing to draw. Generate a file for it, or trade it from the Scanner levels.
Troubleshooting
- The one-off replaced or was replaced by the bundle. This should not happen, because one-off names are unique. If a study went missing, re-import the bundle and the one-off together.
- Nothing plots for a watchlist symbol. Confirm the symbol was on the list when you clicked Generate, and that you imported the downloaded file.
- The file plays as a video. You double-clicked a
.tsfile. Import it through the Studies panel instead.
Related
Was this article helpful?
Still need help?
Can't find what you're looking for? Our support team is here to help.
Contact Support