Install the ThinkOrSwim studies
This guide imports the Volatility Box study files into ThinkOrSwim and plots the models on your charts. It takes a few minutes the first time and about thirty seconds on each weekly update after that.
Watch: Part 9 of the Volatility Box onboarding series.
Before you start
- ThinkOrSwim desktop, installed and signed in. Importing study files is a desktop action; mobile cannot import them.
- The study bundle downloaded from the Indicator Generator. If you have not downloaded it, see Generate the ThinkOrSwim studies first.
Step 1: Unzip the bundle
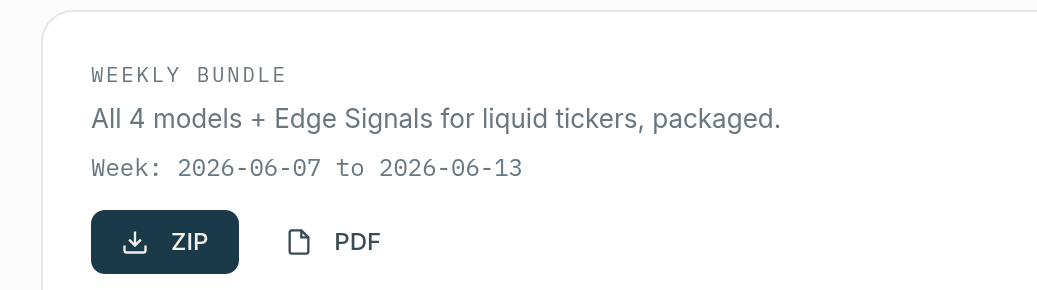
The bundle downloads as a .zip. On a Mac, double-click it to unzip. On Windows, right-click and choose Extract All. Inside are four study files, each ending in .study.ts:
ti_vbd, aggressive and conservative: the Daily models.ti_vbh, aggressive and conservative: the Hourly models.
Those four files cover every symbol in the bundle. There is no separate file per symbol. The .zip also holds a PDF listing the symbols included that week. Do not double-click a .ts file: ThinkOrSwim reads it on import, but your computer does not recognize the format and may try to play it as a video.
Step 2: Import the four files
- Open ThinkOrSwim and click the Studies icon at the top right.
- Click Import.
- Browse to the unzipped folder and select all four
.tsfiles. - Click Open.
On a first import, that is the whole process. From the second week on, ThinkOrSwim asks whether to replace the existing files. Click Yes for each, four times for the four-file bundle. Replacing keeps the studies tied to any chart settings, study sets, and styles you have already configured, so your charts update without being rebuilt.
Step 3: Add a model to a chart
- Open a chart and load a symbol that is in the bundle.
- Open the studies search and type
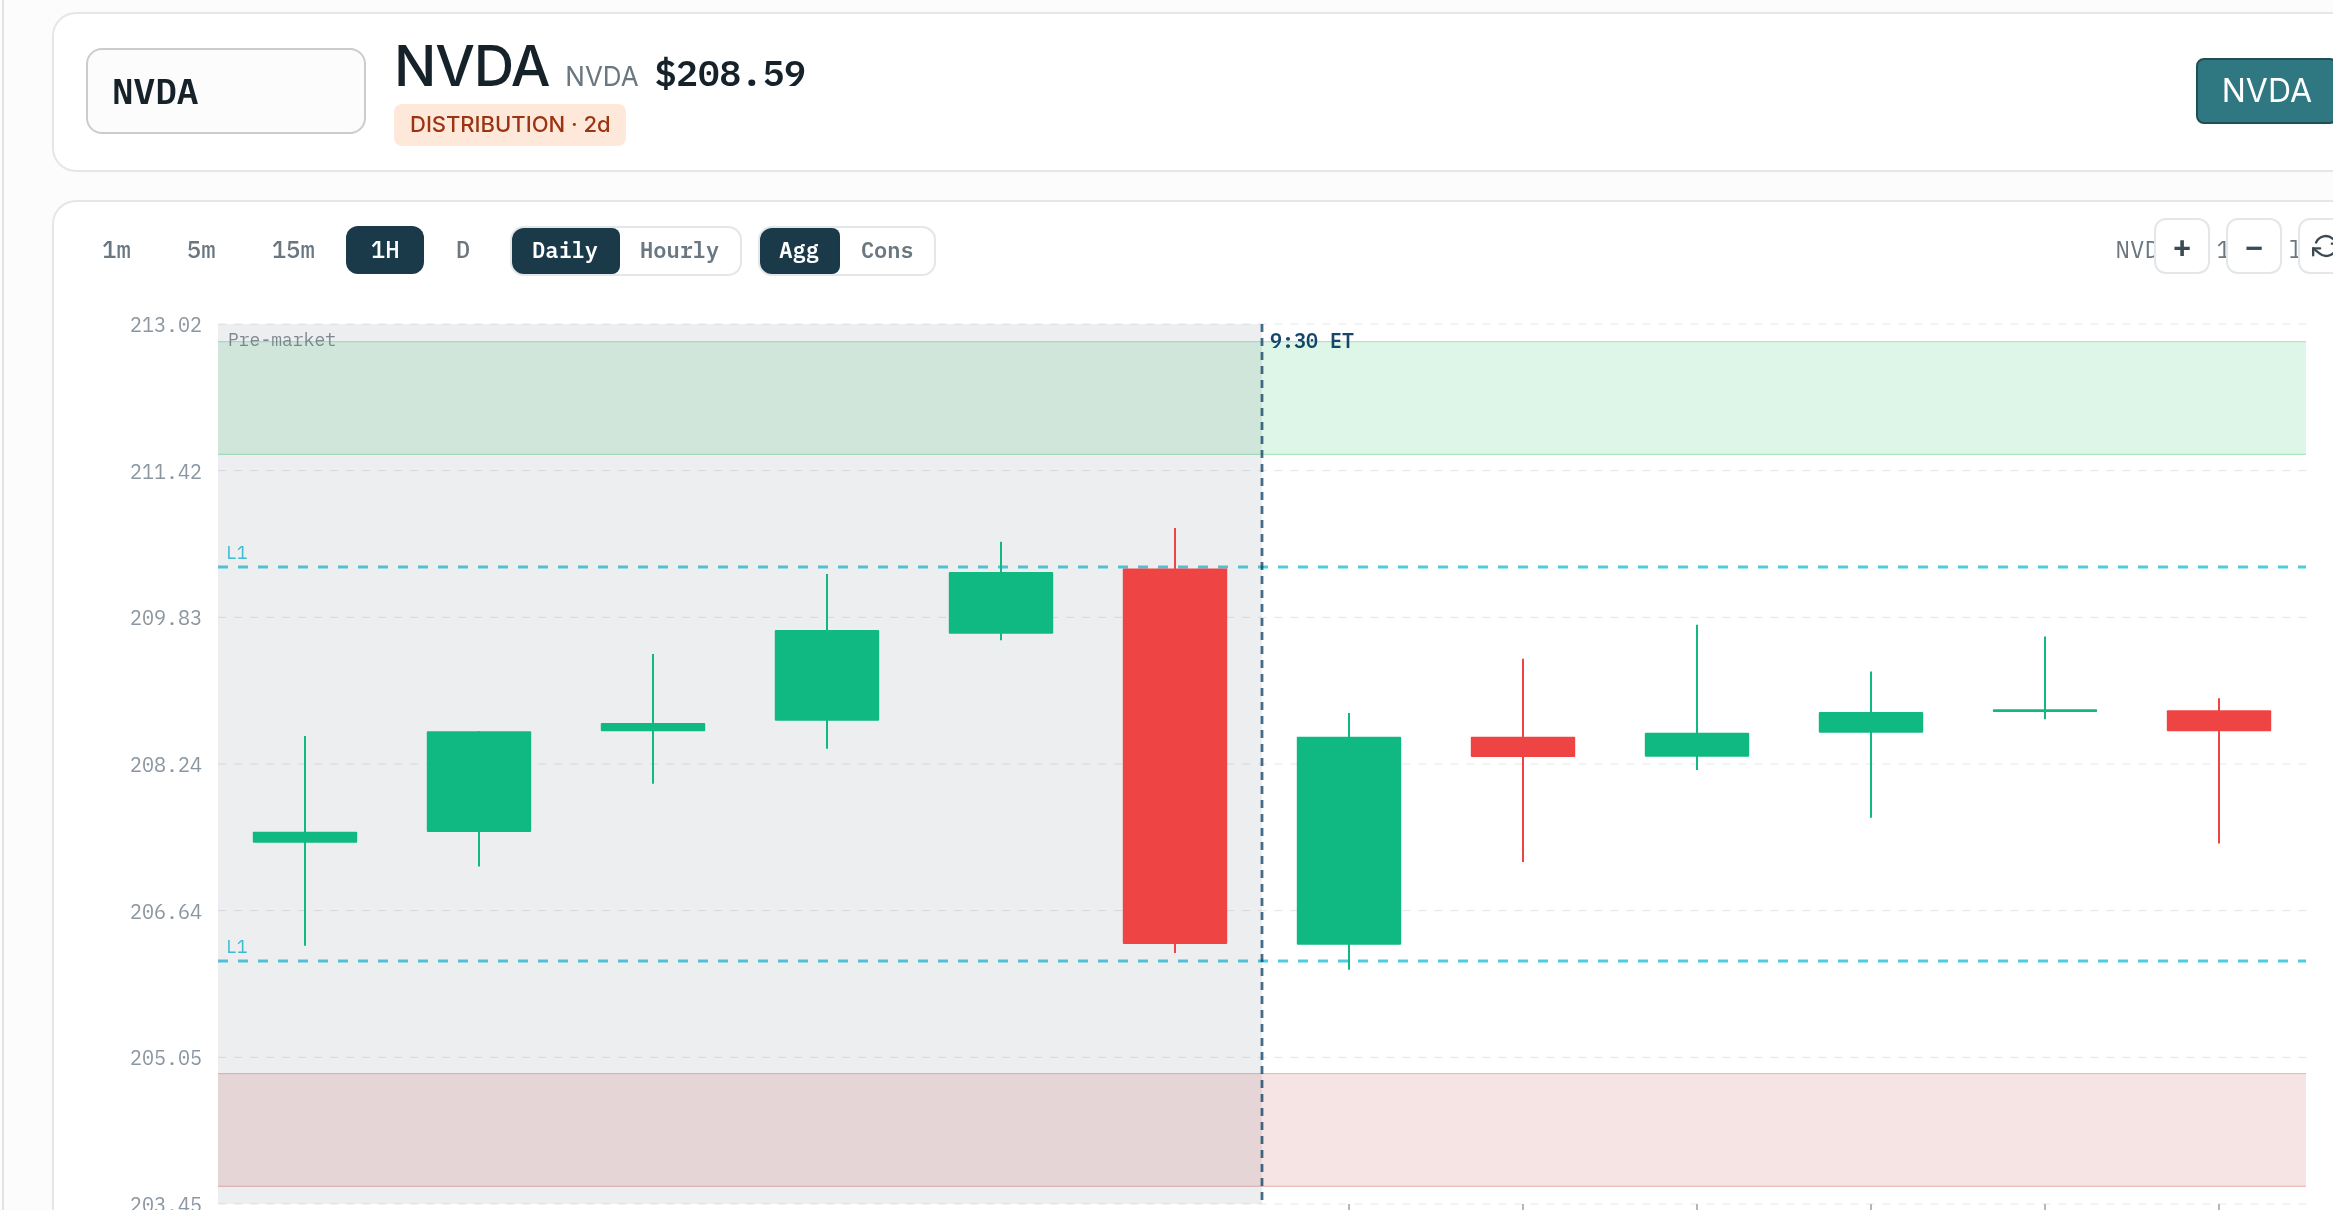
ti_vbdfor the Daily models orti_vbhfor the Hourly models. - Add the aggressive or conservative study you want. The bands plot over price.
Match the model to the timeframe: Hourly models (ti_vbh) on intraday charts, Daily models (ti_vbd) on the daily chart.
Verify it worked
Load a symbol from the bundle and confirm the bands plot. If you load a symbol that is not in the bundle, nothing plots. That is expected, not a failed import: generate a custom file for that symbol, or trade it from the Scanner levels.
Troubleshooting
- The file opens as a video or as text. You double-clicked the .ts file. Import it through the Studies panel instead of opening it directly.
- Nothing plots on the chart. The symbol is not in this week’s bundle, or a Daily study is on an intraday chart. Check the PDF symbol list and match the model to the timeframe.
- The levels look stale. The bundle is dated by week. If the week in the file name has passed, download and import the current one.
Update every week
The models are recalculated each week. Download the new bundle, import the four files, and click Yes to replace. The Indicator Generator shows the week range so you can confirm you are on the current models. See Weekly indicator updates.
Related
Was this article helpful?
Still need help?
Can't find what you're looking for? Our support team is here to help.
Contact Support