Understanding conviction scores
The conviction score is a 0 to 100 number, shown with a letter grade, that ranks how many of the model’s conditions line up behind a Scanner setup. The higher the score, the more confirmation stacked behind that signal. Use it to read the Scanner top down and spend your attention on the strongest setups first.
How it works
The Scanner runs the model, the breach, and the confluence layers across the market and ranks the results. Each setup carries a score from 0 to 100 and a letter grade that summarizes how strong the setup is relative to the rest of the list. The grade runs A+, then A, then B, and down from there.
The score blends the things that make one breach more tradeable than another: how the model has performed historically on that symbol, whether the setup runs with the Market Pulse trend or against it, how fresh the trigger is, and the reward against the risk at the entry. The exact weighting is part of the platform. What reaches the Scanner is the finished number, which already accounts for those inputs.
The grade ranks the list. It is not a hard cutoff. An A+ is where the most conditions line up at once; a B has more soft spots. Read down from the top rather than setting an arbitrary numeric floor.
How to use it
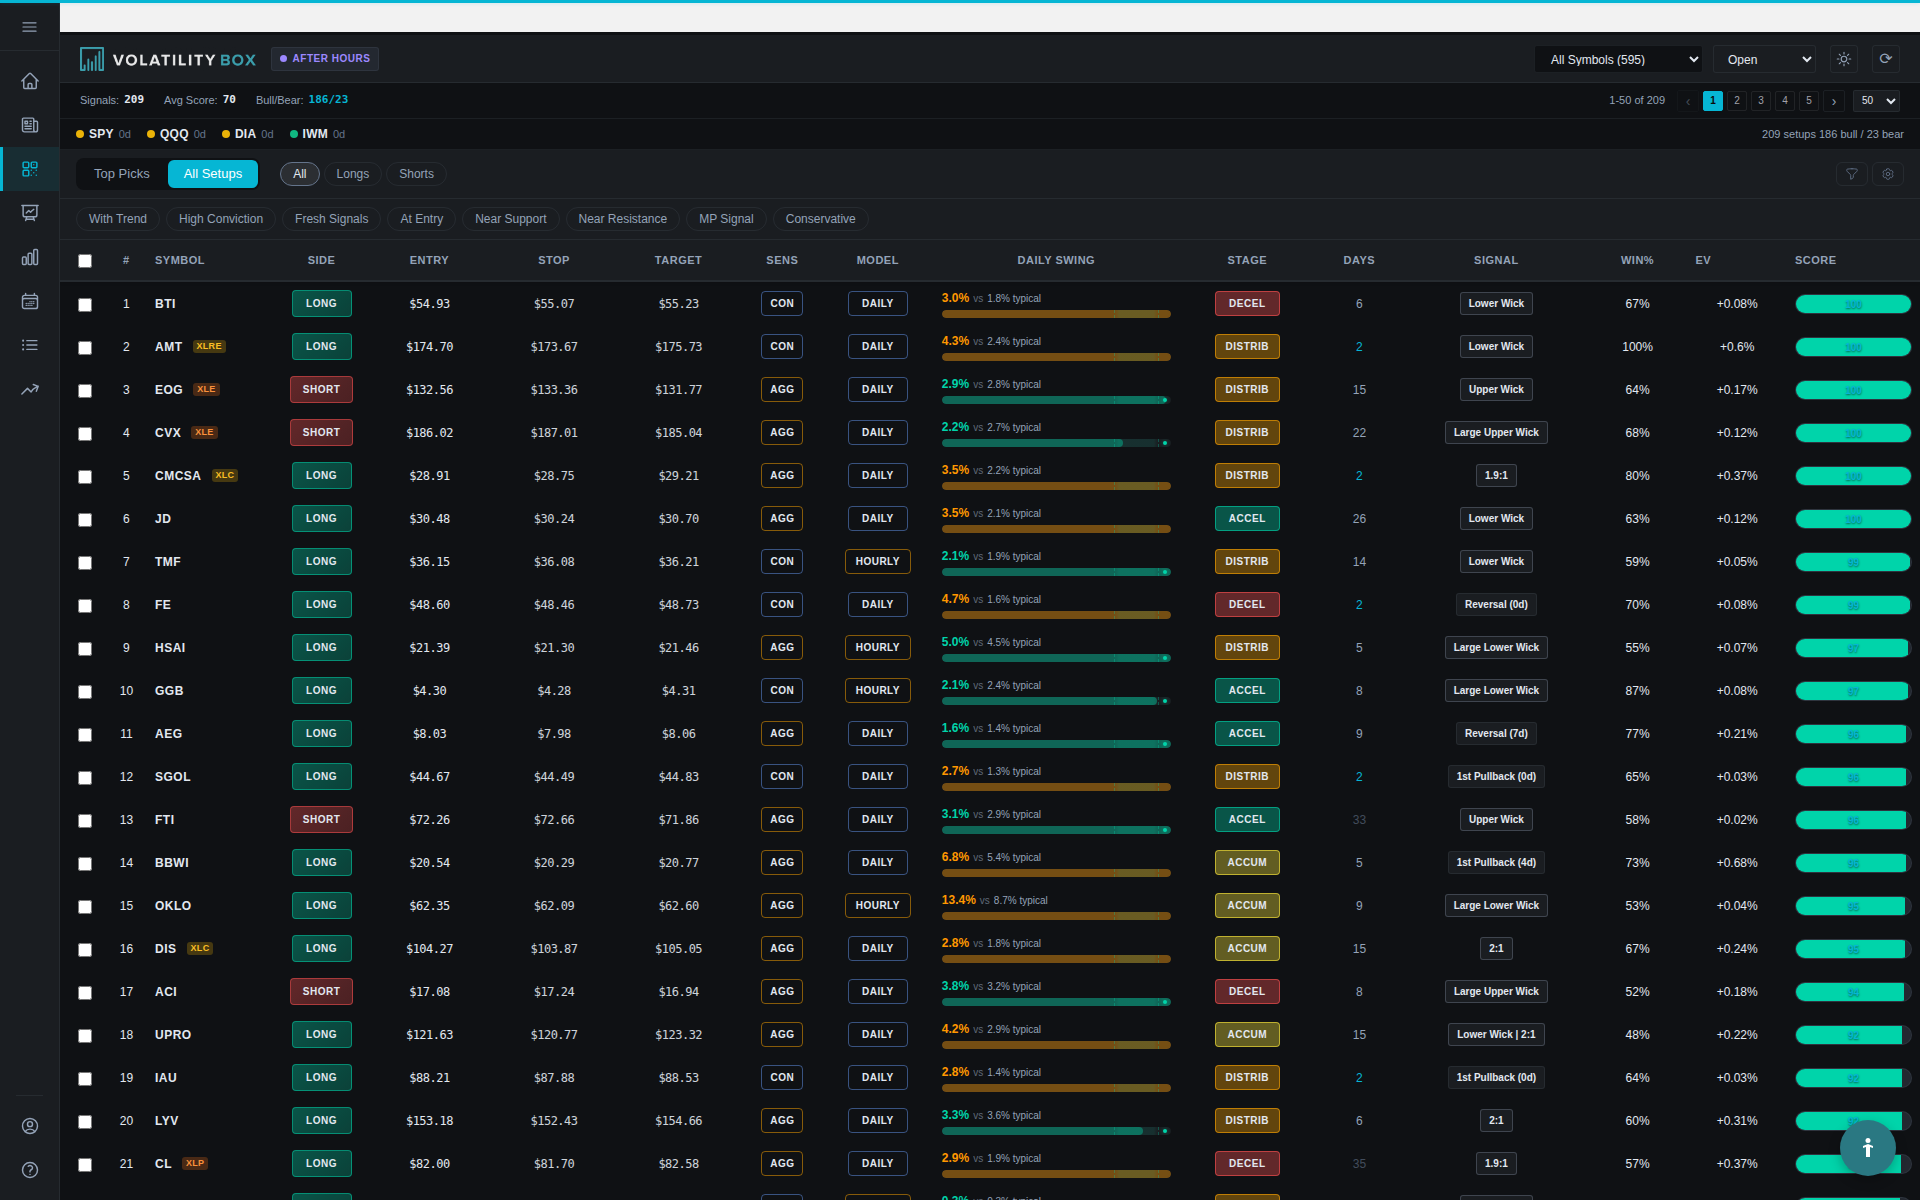
The list arrives sorted by edge, strongest at the top, so the grade is a shortcut for where to look. Instead of staring at a hundred rows, start at the A+ names where most conditions align and work down. That is the fastest way to turn a full Scanner into a short list of setups worth a closer read.
Each row carries the grade alongside the ticker, the direction, the market stage, and which model triggered. Click a row and the right panel fills in the context behind the score: the trade mechanics, the historical backtest results for that strategy, and the support and resistance nearby. The grade tells you where to start; the context tells you whether to take the trade.
Treat the score as a triage tool, not a guarantee. A high-conviction setup can still stop out, and a lower one can reach its target. The score speaks to probability across many trades, not the outcome of any single one. Manage every trade on its own terms once you are in it.
Related
Was this article helpful?
Still need help?
Can't find what you're looking for? Our support team is here to help.
Contact Support