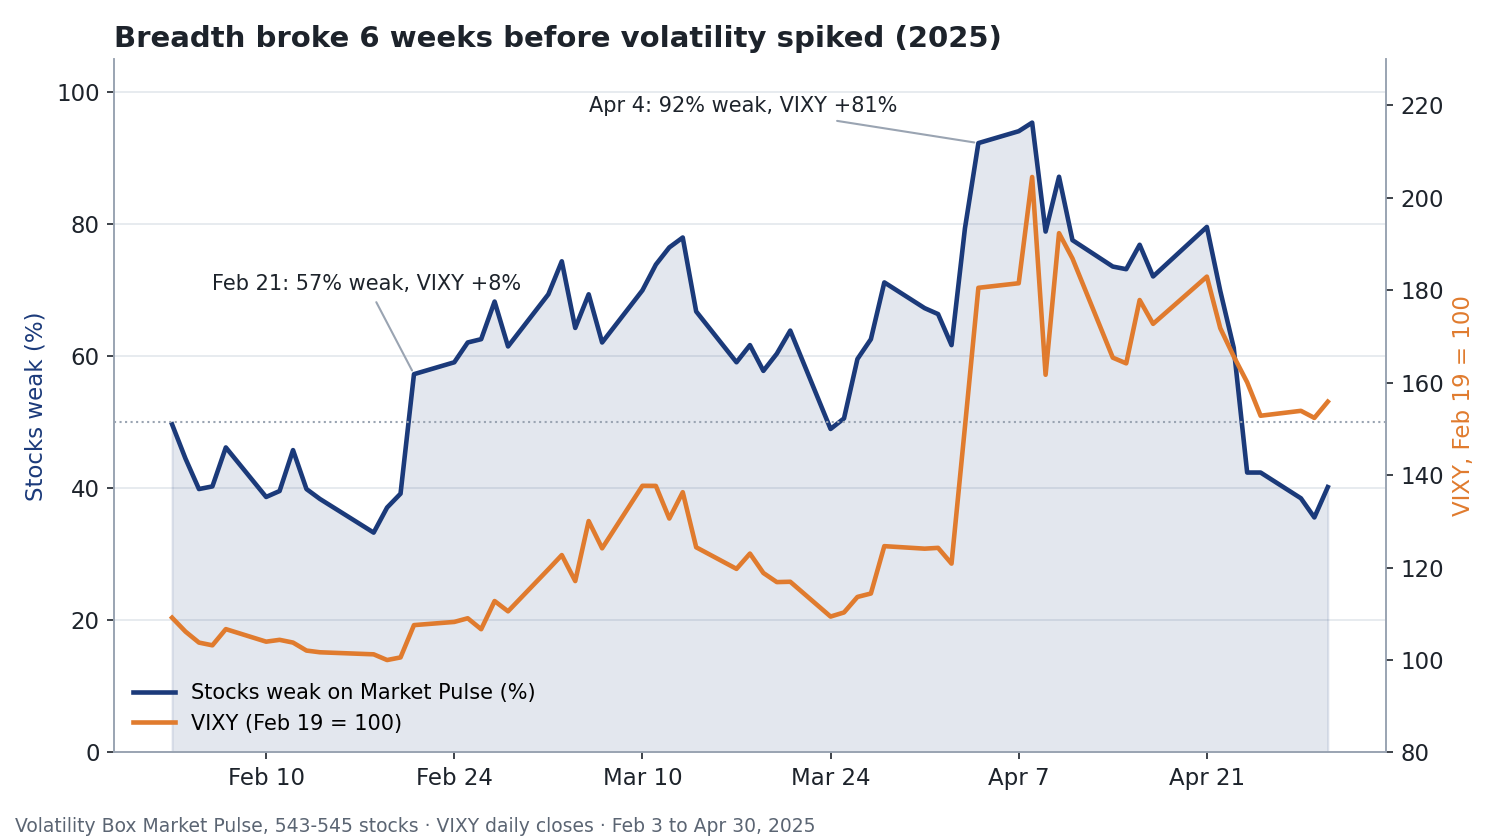
In February 2025, more than half of the stocks we track turned weak while the volatility market barely reacted. The big volatility spike came six weeks later, in April. By then, 92% of stocks were already weak. Here is what market breadth showed, and what it did not.
Key takeaways
- On February 21, 2025, 57% of 543 stocks were weak on Market Pulse, while VIXY was up only 7.6%.
- The volatility spike came 30 trading days later. On April 4, 92% of stocks were weak and VIXY was up 81%.
- Weak breadth is common: more than half of stocks were weak on about 1 day in 4 since August 2024, and most of those days did not lead to a crash.
What is market breadth?
Market breadth measures how many stocks are taking part in a move, not just how the index is doing. An index like the S&P 500 is weighted by size, so a handful of giant companies can hold it near a high while most stocks fall.
We measure breadth with Market Pulse, our trend reading for every stock. Each day, every stock gets a color: Green, Yellow, Orange or Red. We count a stock as weak when it is Orange or Red. Breadth is the share of stocks that are weak.
You can see how each Market Pulse stage has played out over two decades in our 21-year Market Pulse study.
What happened before the April 2025 VIX spike?
For volatility, we use VIXY, a fund that tracks short-term VIX futures, because its daily prices are in our database. Here is how breadth, SPY and VIXY moved through the selloff.
| Date | Stocks weak | SPY from its high | VIXY from Feb 19 |
|---|---|---|---|
| Feb 19 (SPY record close, $612.93) | 37% | 0% | 0% |
| Feb 21 | 57% | -2.1% | +7.6% |
| Mar 14 | 67% | -8.2% | +24% |
| Apr 4 | 92% | -17.6% | +81% |
| Apr 8 (SPY’s low close, $496.48) | 95% | -19.0% | +105% |
| Apr 25 | 42% | -10.2% | +53% |
Breadth jumped from 39% to 57% between February 20 and 21, two days after SPY’s record close. VIXY crept up through March, then exploded in early April. By then, more than half of our stocks had been weak on every day but one for six weeks.
Why did breadth turn before the VIX?
The VIX reads fear in options on the S&P 500 index. It rises when traders rush to buy protection, which usually happens after the index drops hard. A slow slide, where one stock after another rolls over, can leave the index calm for weeks.
Breadth reads the stocks themselves. It counts what is already happening underneath the index, before it shows up in the index price or in option prices. That is why the two can disagree for weeks before they line up in a spike.
What is a volatility regime, and how do you spot a shift?
A volatility regime is the market’s current mood: calm and trending, or choppy and fast. A shift from one regime to the other is when trading rules that worked stop working, and stops that fit last month get run over.
Breadth gives you a second view of that shift alongside the VIX. For a full walkthrough of methods, from simple rules to models, see our guide to volatility regime detection.
Is weak market breadth a sell signal?
No. More than half of our stocks are weak more often than most traders expect. Since August 2024, that happened on 125 of 532 trading days, about 1 in 4. What usually came next was not a crash.
| Days | SPY about 4 weeks later | SPY fell 5% or more | |
|---|---|---|---|
| Days with 57%+ of stocks weak | 125 | +2.15% on average | 8.8% of the time |
| All days | 532 | +1.30% on average | 5.1% of the time |
When most stocks are weak, a bigger drop is somewhat more likely. But the average month afterward was actually better, because weak markets are where dips get bought. Treat breadth as a warning light, not an exit sign.
How do you trade weak breadth with the Volatility Box?
Weak breadth is where buying the Volatility Box levels has worked best for us.
When SPY’s own Market Pulse was Orange or Red the day before, buying a stock’s first touch of its daily L3 level closed higher three days later about 60% of the time. That covers about 18,000 trades from September 2024 to September 2026.
When SPY was Green or Yellow, the same trade closed higher 50.5% of the time. One honest note: the March to April 2025 crash supplies about a quarter of the weak-market trades. Without it, the figure is 57.5%.
Three ways to put this to work:
- Check breadth before you trust a calm index. In February 2025, SPY was at a record while the market underneath was already cracking.
- Do not sell on breadth alone. One day in four looks like this, and most of them pass.
- Get more interested in the levels when breadth is weak, not less. That is when the lower cloud has done its best work.
For the VIX side of the picture, see how to trade the VIX and why funds like UVXY drift lower over time.
Data: Market Pulse daily colors for our tracked universe (543 to 545 stocks in this period), and SPY and VIXY daily closes from our price database. “SPY about 4 weeks later” uses the first close at least 28 calendar days after each day.
L3 figures use daily Volatility Box levels rebuilt from regular-session minute bars: 17,987 first touches when SPY was Orange or Red and 33,626 when it was Green or Yellow. Past results do not guarantee future ones.