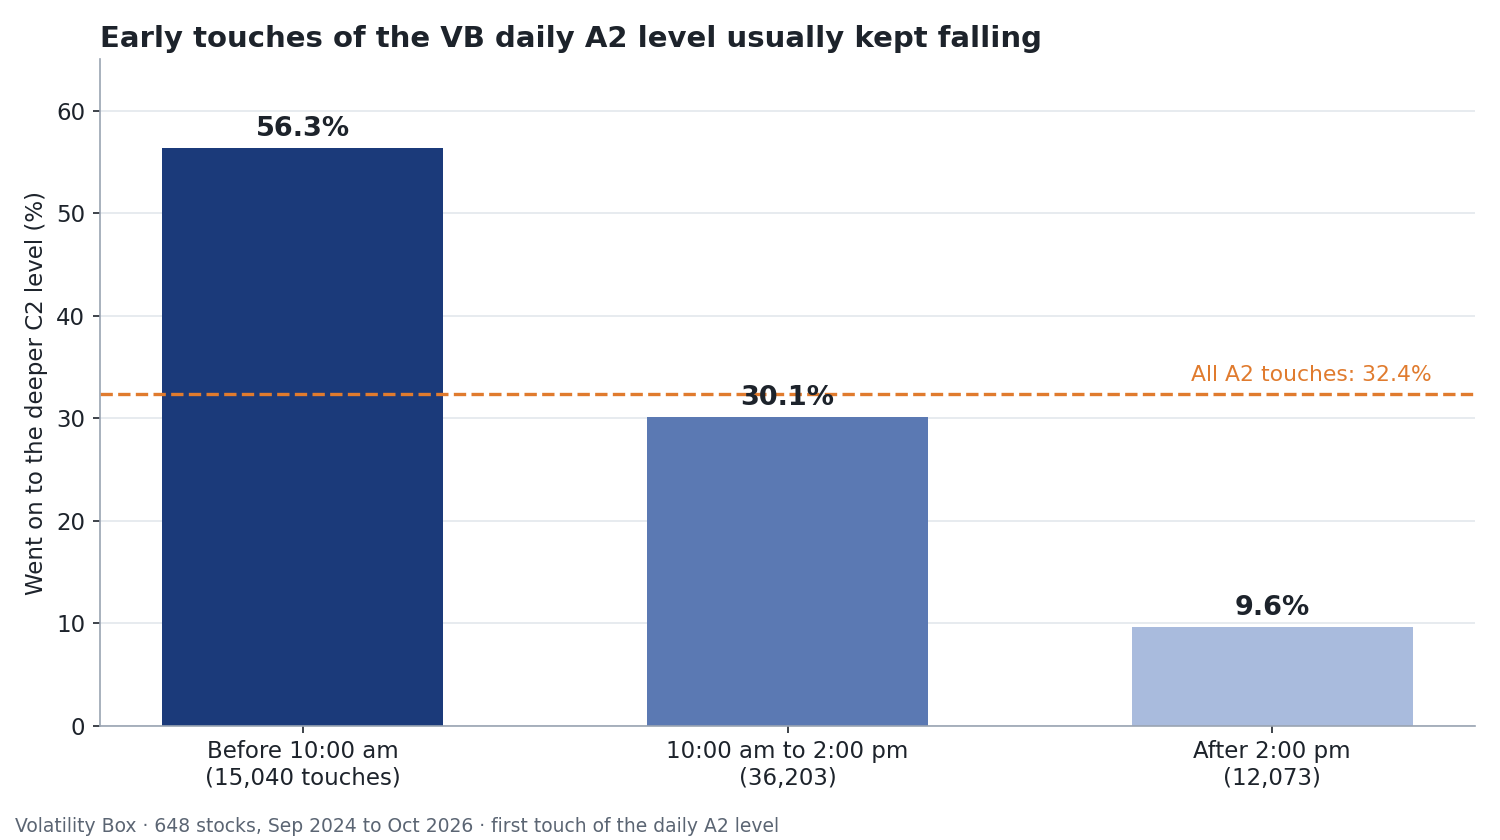
The time of day a stock first drops into its Volatility Box tells you a lot about how much further it can fall. We checked 63,316 of these touches across 648 stocks. Early touches usually kept going. Late touches usually marked the low of the day.
Key takeaways
- Before 10:00 am, a first touch of the VB daily A2 level went on to the deeper C2 level 56.3% of the time.
- After 2:00 pm, A2 turned out to be the day’s low 69.3% of the time.
- Part of the effect is simply less time left in the day, so treat it as a guide to patience, not a buy signal.
What is the Volatility Box?
The Volatility Box is our model of how far a stock usually travels from its high or low in a day. It is built from each stock’s own history, so a quiet utility and a fast-moving chip stock each get levels that fit them.
Each trading day, the box draws clouds above and below price. The cloud below the day’s high is where longs get their edge, and the cloud above the day’s low is where shorts get theirs. You can read more on how the levels work.
There are two clouds on each side. The aggressive cloud sits closer to price and gets touched more often. The conservative cloud sits further out and gets touched less often, but carries more weight when it does.
What are the VB daily levels A2, C2 and C4?
Think of the levels as rungs on a ladder below the day’s high. A1, A2 and A3 are the rungs of the aggressive cloud. C1, C2 and C3 are the rungs of the conservative cloud, deeper down, and C4 is the far edge beyond it.
The daily model moves its rungs with the day’s running high. If a stock rallies to a new high at 11:00 am, every rung below it moves up with it. A touch means price traded down to that rung at some point in the day.
What did we measure?
We studied 648 stocks over 523 trading days, from September 2024 to October 2026. That is 310,020 stock-days, using regular-session prices only. On 63,316 of those days, price traded down to the daily A2 level.
For each of those days, we recorded the minute of the first A2 touch. Then we checked how far price went for the rest of the session, rung by rung. “A2 was the low” means price touched A2 but never reached the next rung, Agg L3, that day.
What time of day do stocks hit their low?
The answer depends on when the first touch happens. Here is what the 63,316 touches did, split by the time of day.
| First touch of A2 | Days | Went on to C2 | Reached C4 | A2 was the low |
|---|---|---|---|---|
| Before 10:00 am | 15,040 | 56.3% | 31.5% | |
| 10:00 am to 2:00 pm | 36,203 | 30.1% | 37.7% | |
| After 2:00 pm | 12,073 | 9.6% | 69.3% | |
| All A2 days | 63,316 | 32.4% | 14.8% | 39.3% |
An early touch was usually just the start of the move. More than half went all the way to C2, and almost 1 in 3 reached C4, the deepest rung.
A late touch usually was the move. Seven times in ten, price did not trade one rung lower before the close.
Why does an early touch usually go deeper?
Part of the answer is time. A touch at 9:45 am leaves six hours for sellers to keep pushing. A touch at 2:30 pm leaves 90 minutes. Less time left means less room for a deeper move.
The other part is how the first hour trades. The open carries overnight news, gaps and the heaviest volume of the day. A stock that is already at A2 by 10:00 am is usually under real pressure, not just drifting.
This lines up with what we found about the best and worst hours to trade the edges. The open and the close behave differently, and the levels show it.
How should you use the time of the first touch?
Use the clock to decide how patient to be, not whether to trade.
- Early touch, before 10:00 am: expect more room below. Do not treat A2 as the floor. Watch the conservative cloud, and size so a move to C2 does not shake you out.
- Midday touch: this is the normal case. About 3 in 10 went on to C2, close to the overall average.
- Late touch, after 2:00 pm: A2 often held for the rest of the day, so there is little reason to chase a deeper fill.
For more on how volatility changes through the session, see our guide to intraday volatility trading.
Does a late touch make a better buy?
No, and this matters. When we tested buying on the timing alone, it did not add an edge. “Late touches usually mark the day’s low” is not the same as “late touches make better trades.”
The levels are a ruler for how far price usually travels, not a promise that it turns. Use the time of the touch together with the rest of your plan: the trend, the Edge Signal, and where you will put your stop.
Data: daily Volatility Box levels rebuilt from regular-session minute bars, using each weekday’s model; first-touch times measured in minutes after 9:30 am ET. 648 stocks, Sep 3, 2024 to Oct 2, 2026. Past results do not guarantee future ones.