FAIL: error: no such post
Market Pulse reduces any chart to four stages, and members use it as the regime layer behind every other signal. This study asks the direct question: if you traded the stages themselves, what would 21 years of data pay?
We backtested stage-based entries across roughly 600 liquid symbols from December 2004 through August 2025. The winner was not the stage turn itself. It was the first rest after the turn.
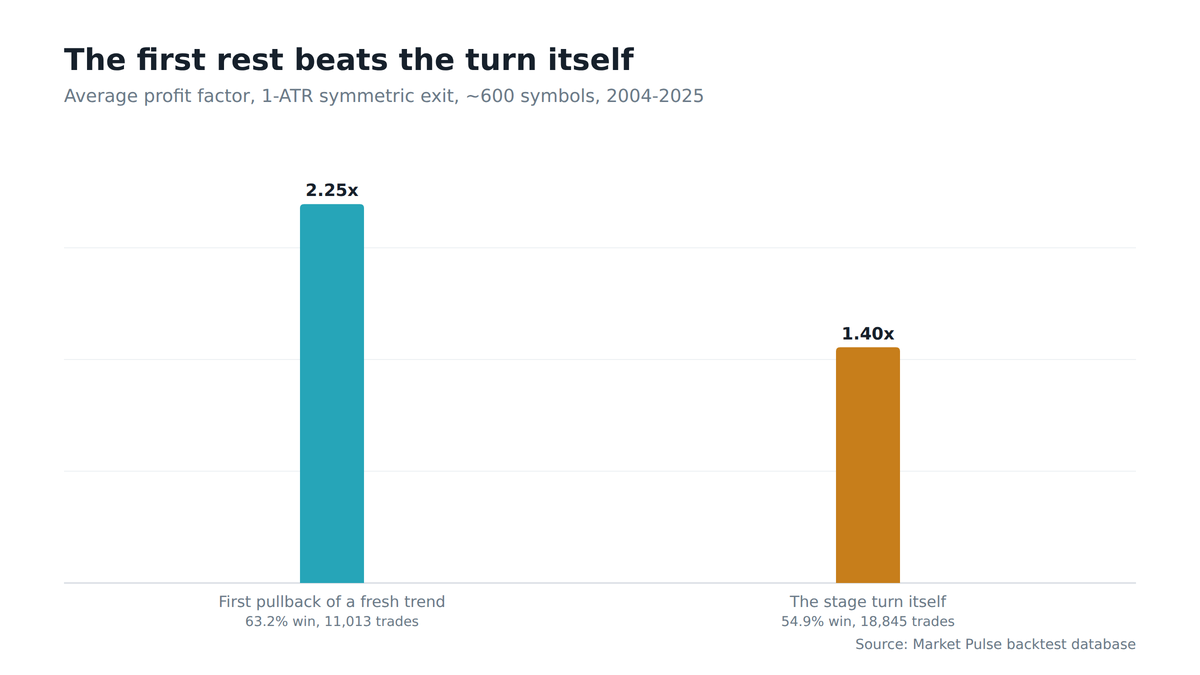
The headline: buy the first pullback of a fresh trend
With a simple, symmetric exit (one ATR target, one ATR stop), the entries rank cleanly across two decades:
| Entry (long, 1:1 ATR exit) | Trades | Win rate | Avg profit factor |
|---|---|---|---|
| First pullback after a stage turn | 11,013 | 63.2% | 2.25 |
| The stage turn itself (trend reversal) | 18,845 | 54.9% | 1.40 |
Buying the moment Market Pulse flips stages is profitable, and has been for 21 years. But it is the rough version of the trade:
- More signals, more noise: 18,845 trades at a 54.9% win rate, an eight-point lower win rate than the pullback entry.
- The pullback lets the trend prove itself: waiting for one rest raised the win rate to 63.2%.
- Better than double the payoff: the average profit factor climbs from 1.40 to 2.25.
The pattern our sector system found in sixteen months of recent data, the same data that made the First Pullback the top entry there, shows up here across two full decades and hundreds of names. Different engine, same conclusion.
The exit ladder: win rate is a dial, not a verdict
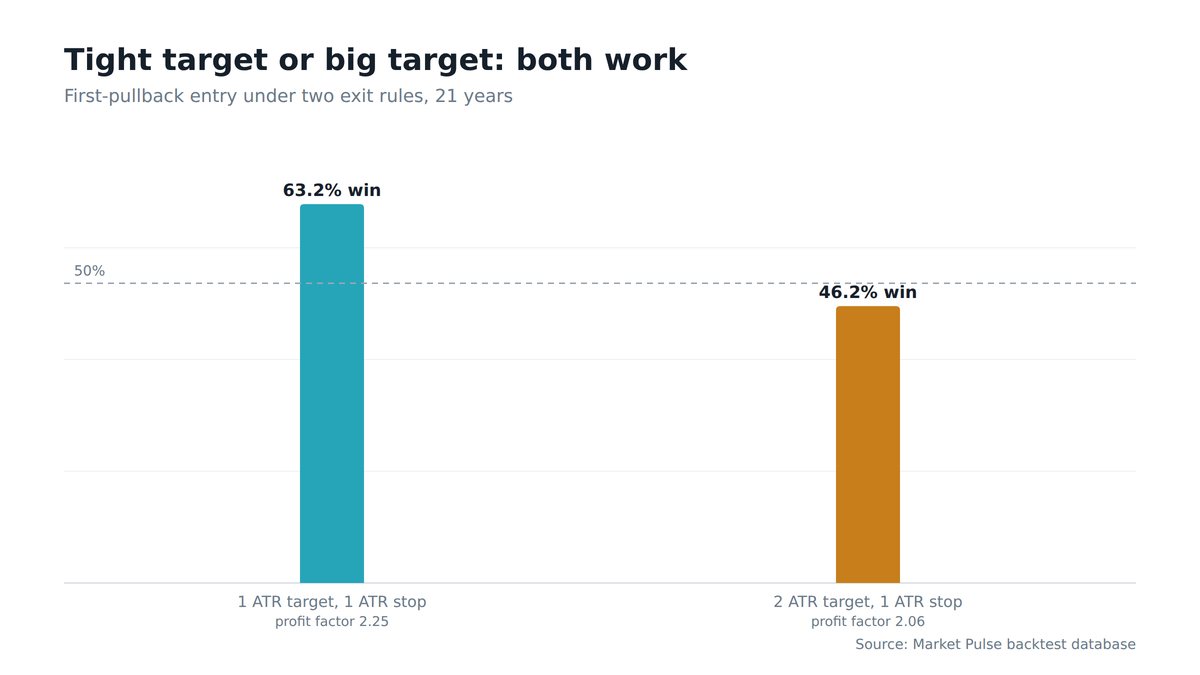
Stretch the target and the win rate falls while the payoff grows. Here is the same first-pullback entry across the exit ladder.
| Exit | Win rate | Avg profit factor |
|---|---|---|
| 1 ATR target, 1 ATR stop | 63.2% | 2.25 |
| 2 ATR target, 1 ATR stop | 46.2% | 2.06 |
Both are strong systems; they simply pay differently.
- The tight target: wins often and compounds steadily.
- The wide target: loses more often than it wins, yet keeps nearly the same profit factor because the winners are twice the size.
Which one suits you is a temperament question, and it feeds directly into how you size positions with volatility. Knowing that trade-off in advance is exactly what a 21-year table is for.
The long-short gap, again
Every entry we tested worked better long than short. The first pullback short still cleared the bar, making it one of the more respectable short edges we have measured.
On the stage-turn entry the gap was wider still. This matches what we find in study after study: short edges exist, but they run thinner, and they demand more from execution.
How this fits the system
Members do not primarily trade Market Pulse as a standalone entry, and this study does not change that. Its job is context, the same job any regime detection layer performs: the stage tells you whether the tape behind your setup is accelerating, resting, or rolling over.
What the data adds is that the stages carry real, durable signal on their own, enough to clear 2.0 profit factors over 21 years. And the highest-value moment in the cycle is consistent: a fresh trend taking its first breath.
When a Volatility Box level, an Edge Signal, or a squeeze fires in that specific window, it is firing with two decades of stage statistics at its back. That is the payoff of knowing which phase of the regime you are trading in, instead of fighting it.
The fine print
- Signal-level backtests: no slippage or costs are modeled.
- Clean fills assumed: the ATR-based exits assume every stop and target fills at its level.
- Averages, not names: results across 600 symbols will not match any single name.
But at this sample size, across this many years, the ranking itself is about as robust as market evidence gets.
Frequently asked questions
Is buying the Market Pulse stage turn itself profitable?
The stage-turn entry posted a 1.40 average profit factor across 18,845 trades at a 54.9% win rate over 21 years. It is profitable, but the rougher version of the trade. Waiting for the first pullback after the turn lifted the profit factor to 2.25.
How does the first-pullback entry perform on the short side?
The first-pullback short posted a 1.84 profit factor at a 56.2% win rate, one of the more respectable short edges measured. Every entry tested worked better long than short, and on the stage-turn entry the long-short gap was wider still.
Does a wider profit target improve the first-pullback results?
At a two-ATR target the first-pullback win rate falls to 46.2%, yet the profit factor holds at 2.06 because the winners are twice the size. The tighter one-ATR target wins far more often, at 63.2%, and pays a 2.25 profit factor.
How many trades and symbols did the Market Pulse study cover?
The first-pullback entry produced 11,013 trades and the stage-turn entry 18,845, across roughly 600 liquid symbols from December 2004 through August 2025. That is about 21 years of stage-based data behind the ranking.
How much stronger is the first pullback than the stage turn?
The first pullback wins at 63.2% versus 54.9% for the stage turn, an eight-point gap over 21 years. Its average profit factor is better than double, 2.25 against 1.40, at the same one-ATR symmetric exit.
Does the Market Pulse backtest account for trading costs?
Across 600 symbols these signal-level backtests model no slippage or costs, and the ATR-based exits assume every stop and target fills at its level. Results are averages, so no single name will match them, but at this sample size the ranking is robust.