BlackRock faded at its upper Volatility Box zone on Nov. 6: 2.0R in 26 minutes
The setup
BlackRock ($BLK) rose 0.7% on Nov. 6, and at its high of the session it was 2.1% above the prior close. Headline that day: Zacks Industry Outlook Highlights BlackRock, Ameriprise Financial and Invesco.
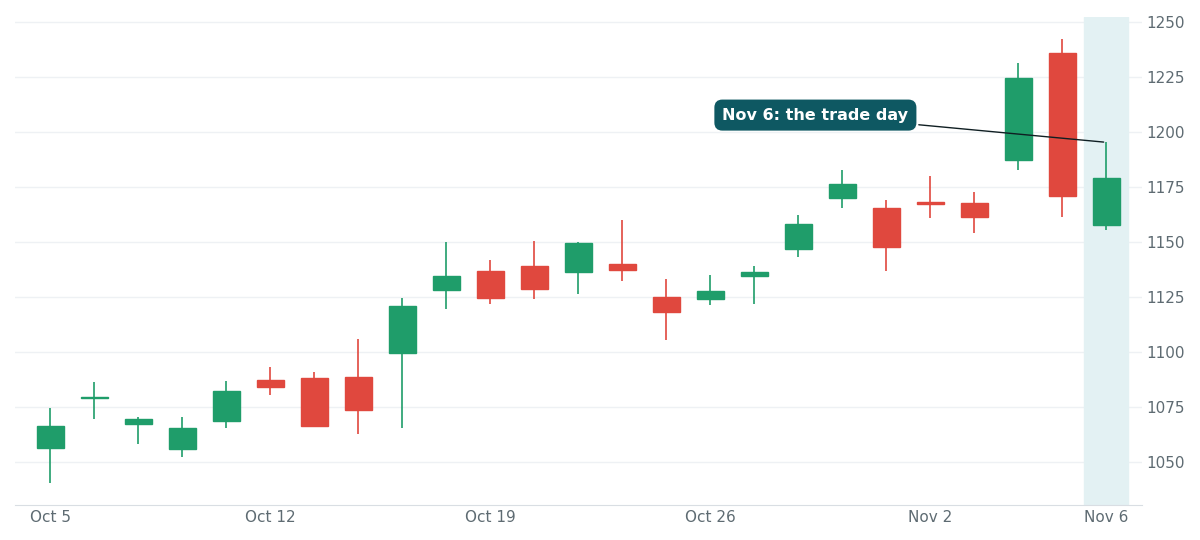
Over the 25 sessions before, $BLK had gained 10.5%, so the day extended the recent trend.
That kind of move is how a stock reaches the upper zone of its daily Volatility Box: the level where price is stretched relative to its own recent range. Stretched does not mean wrong about the story. It means the move has run about as far as this stock usually runs in a day.
The trade
Price reached the L3 level of the Daily Conservative Volatility Box and the Edge Signal confirmed the short at $1194.60 at 10:51 a.m. ET. The stop was $1198.65 and the target $1186.52, both set before the entry.
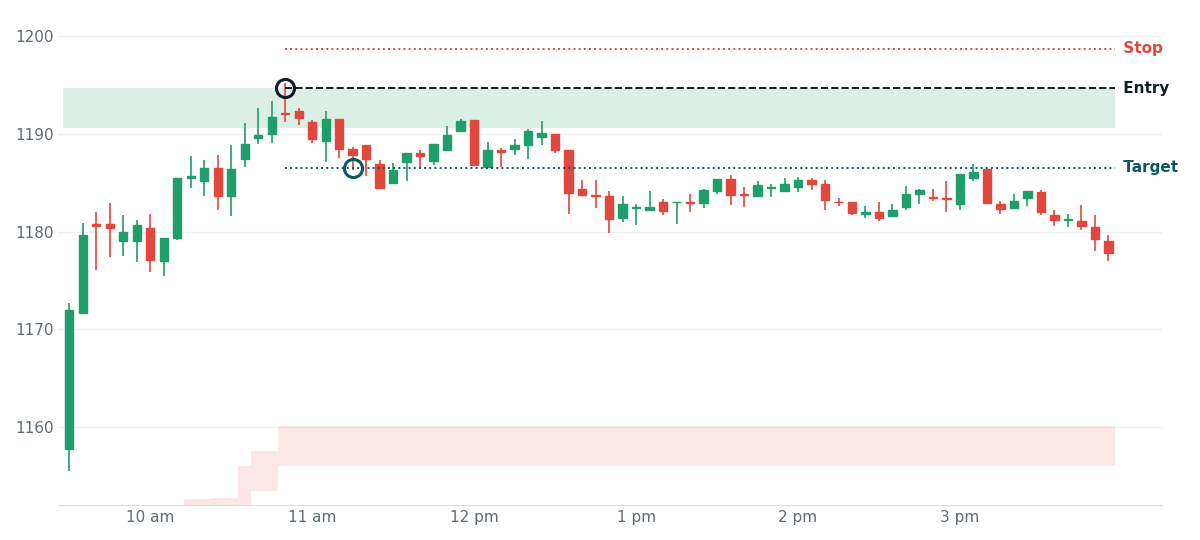
The target hit at 11:18 a.m. ET, 26 minutes after the entry, for 2.0R: a 0.7% move with the risk defined the whole way. The result is measured to the target that existed before the trade, not to the best price afterward.
The L3 level is one of the outer levels of the daily model. The deeper the level, the more stretched the move. The stop sits just past it, where the stretch would stop being a stretch, so the risk stays small against the target.
| Date | Nov. 6, 2026 |
|---|---|
| Model | Daily Conservative Volatility Box |
| Level | L3 |
| Direction | Short |
| Entry | $1194.60 at 10:51 a.m. ET |
| Stop | $1198.65, set before entry |
| Target | $1186.52 |
| Time to target | 26 minutes |
| Result | 2.0R, a 0.7% move |
How the zones are drawn and read is covered in Reading the models.
What happened next
Over the next 5 sessions $BLK closed at $1222.91, 2.4% against the short entry. The lowest print in that stretch was $1192.83.
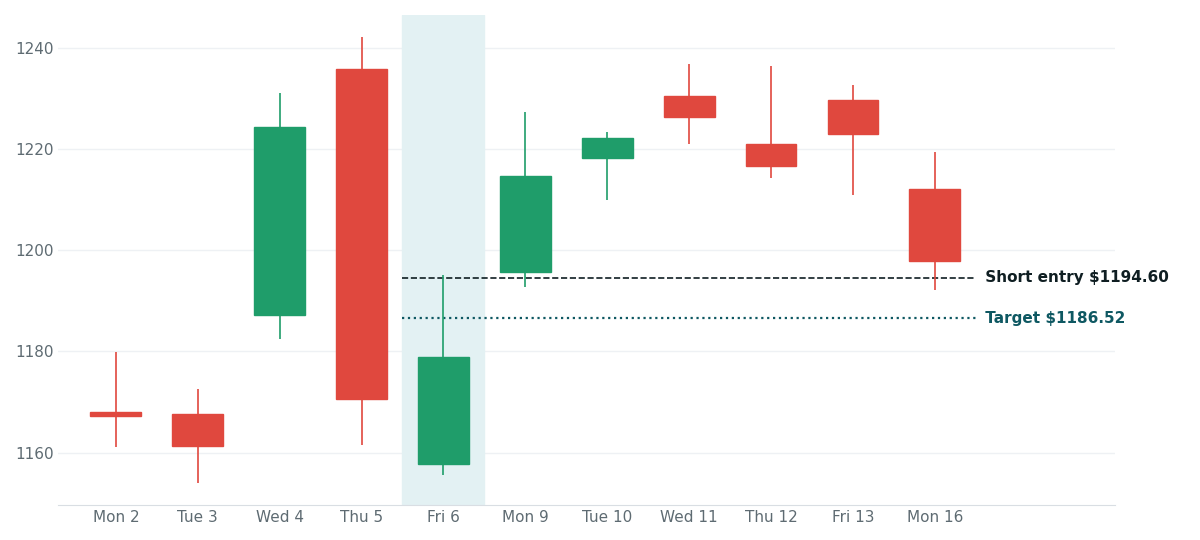
Closes over those sessions: Nov. 9 $1214.71, Nov. 10 $1222.15, Nov. 11 $1226.31, Nov. 12 $1216.61, Nov. 13 $1222.91.
That follow-through is context, not part of the result. The daily Volatility Box model marks a stretch for the session; what a stock does over the following week depends on the trend it is in.
Market Pulse, our trend-stage model, had $BLK in a Green (acceleration) stage going into the trade, with its last daily signal on Oct. 19 (long). A trade against that stage is a fade: a close target and a tight stop, not a call that the trend has ended.
The trend stages are explained in Market Pulse signals.
Questions traders ask about this setup
Why short a stock that was rallying?
The trade is a measured fade from a statistical extreme, not a view on BlackRock itself. The target is close, the stop is close, and both are set before the entry.
What is an Edge Signal?
It is the entry trigger that fires on top of a Volatility Box level. The Volatility Box shows where price is stretched; the Edge Signal shows when the move has started to turn there.
What would have made this trade wrong?
A move through the stop at $1198.65. That level was set before the entry, so the most the trade could lose was known before it was taken.
Does the daily Volatility Box model work for swing trades?
The daily model frames trades that last one to five days, and the hourly models find intraday entries. This example is measured at its target; the week that followed is shown for context.
Is this a recommendation?
No. It is a worked example of how the Volatility Box models define a trade, written after the trade and the following week had played out.