How to Use Volatility to Select Covered Call Strikes in 2026
Learn how IV percentile and expected move calculations determine optimal covered call strikes. Target 16-20 delta at IV above 50% for best returns.
- Why Implied Volatility Determines Your Covered Call Strike Selection
- How to Calculate the Expected Move for Covered Call Strikes
- Using IV Rank and IV Percentile to Time Covered Call Entries
- Delta-Based Strike Selection: Finding the Right Risk-Reward Balance
- The Covered Call Calculator: What to Look For
- How to Select Covered Call Strikes in Different IV Environments
- Covered Call Strike Selection by Days to Expiration
- Calculating Your True Annualized Return on Covered Calls
- Common Covered Call Mistakes That Cost Traders Money
- Rolling Covered Calls: When and How to Extend Your Position
- Backtested Covered Call Performance by IV Environment
- Building a Volatility-Aware Covered Call System
Covered call strike selection is not a guessing game. The optimal strike depends on implied volatility, the expected move of the underlying stock, and your directional outlook. When IV is high, you collect more premium at wider strikes. When IV is low, you must choose between tight strikes with low premiums or wider strikes that barely pay for the risk. This guide covers how to use volatility data to select covered call strikes systematically, calculate your true expected return at different IV levels, and avoid the common mistakes that cost traders thousands in missed opportunity or unnecessary assignment.
Published March 30, 2026
Why Implied Volatility Determines Your Covered Call Strike Selection
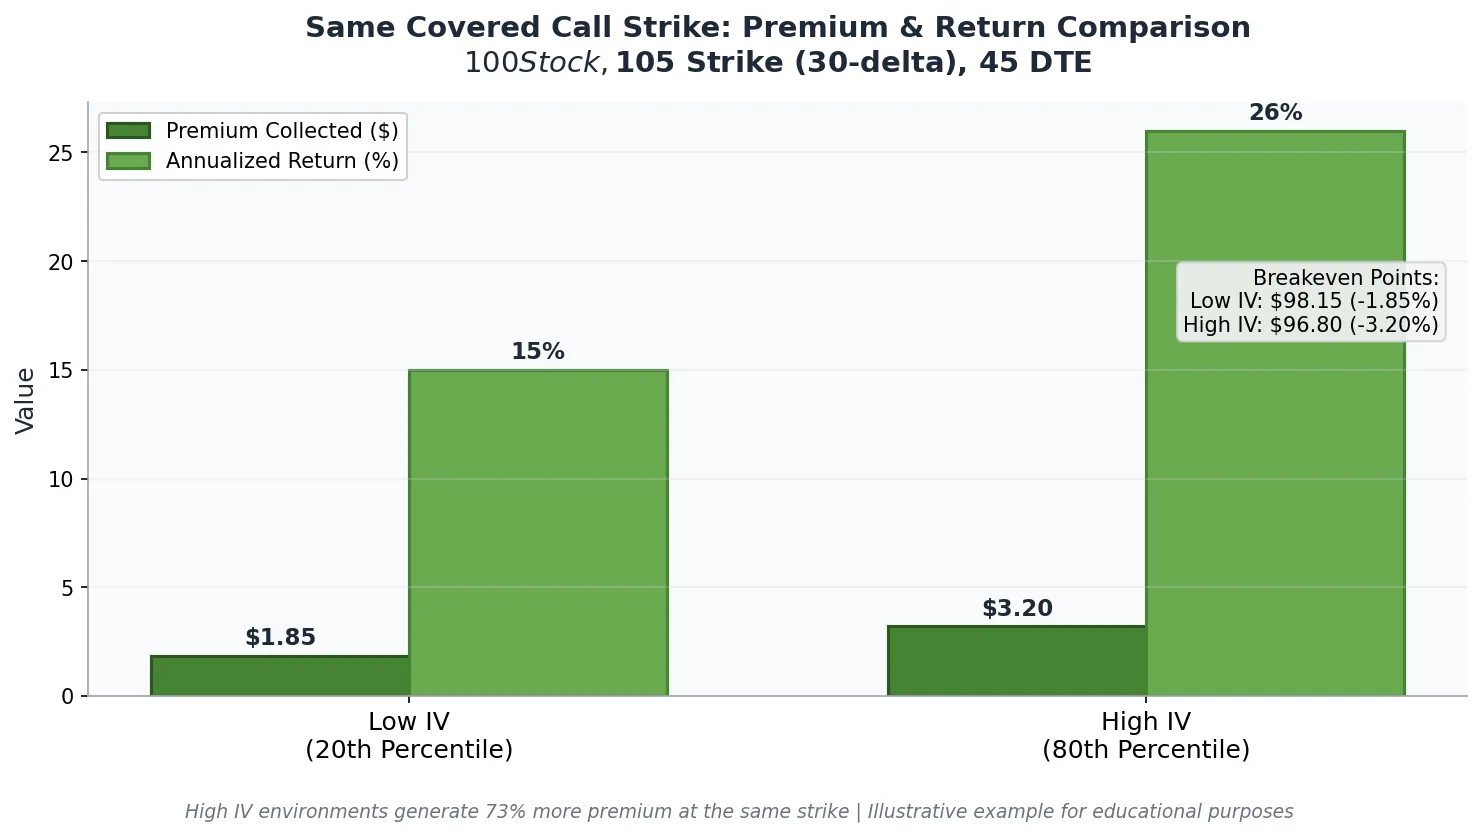
Implied volatility is the single most important factor in covered call strike selection. IV determines the premium you collect, which directly impacts your maximum profit, breakeven point, and annualized return. A covered call written when IV is at the 80th percentile will generate 30-40% more premium than the same strike written when IV is at the 20th percentile.
The relationship works like this: higher IV means the market expects larger price swings. Options sellers demand more premium to compensate for that risk. As a covered call writer, you benefit from this elevated premium because you already own the underlying stock. The stock’s risk is fixed. The only variable is how much premium you collect for capping your upside.
This is why timing matters. Selling covered calls when IV is low locks you into mediocre returns for 30-45 days. Selling when IV is elevated lets you collect premium that would normally require selling much closer to the money. The Volatility Scanner ranks 595 symbols by IV percentile so you can identify which positions in your portfolio are currently offering elevated premium.
How to Calculate the Expected Move for Covered Call Strikes
The expected move tells you how far the market thinks the stock will travel by expiration. For covered call writers, this number defines the boundary between likely retention and probable assignment. Strikes inside the expected move have higher assignment risk. Strikes outside the expected move are statistically more likely to expire worthless, letting you keep both the stock and the premium.
The expected move calculation uses the at-the-money straddle price. Add the ATM call and put premiums together, then multiply by 0.85 to get the 1-standard-deviation move. This range captures approximately 68% of outcomes based on the options market’s pricing.
Expected Move = (ATM Call + ATM Put) x 0.85
Example: AAPL at $200
ATM Call (45 DTE): $6.50
ATM Put (45 DTE): $6.00
Straddle: $12.50
Expected Move: $12.50 x 0.85 = $10.63 (5.3%)
Expected Range: $189.37 to $210.63
A covered call strike at $210 (just inside the expected move upper bound) has roughly a 16% chance of being in the money at expiration. A strike at $215 (outside the expected move) drops that probability to approximately 10%. The tradeoff: the $215 strike pays less premium. Your job is to find the strike where the premium collected justifies the upside you are giving away.
Using IV Rank and IV Percentile to Time Covered Call Entries
IV rank and IV percentile measure how current implied volatility compares to historical levels. IV rank tells you where current IV sits relative to the high and low of the past year. IV percentile tells you what percentage of trading days had lower IV than today.
For covered call writers, IV percentile above 50 is the threshold for attractive entries. At this level, you are collecting premium that exceeds the median for that stock. IV percentile above 70 represents the sweet spot where premiums are genuinely elevated without signaling the kind of event risk (earnings, FDA decisions) that might cause a large gap.
Covered calls written at IV percentile below 30 underperform historically. The premium collected is too small to compensate for the opportunity cost of capping your upside. In low-IV environments, consider waiting for a volatility expansion or widening your strike to compensate for the lower absolute premium.
| IV Percentile Range | Premium Quality | Recommended Action | Typical Delta Target |
|---|---|---|---|
| 0-30% | Below average | Wait for IV expansion or sell closer to ATM | 25-35 delta |
| 30-50% | Average | Acceptable if stock fundamentals support the position | 20-30 delta |
| 50-70% | Above average | Good entry window for income-focused covered calls | 16-25 delta |
| 70-90% | Elevated | Excellent premium; sell wider strikes for same income | 10-20 delta |
| 90-100% | Extreme | Check for event risk; consider shorter duration | 10-16 delta |
The Volatility Scanner displays IV percentile for every symbol, updated in real time. Sorting your watchlist by IV percentile reveals which covered call candidates offer the most attractive premium relative to their historical norms.
Delta-Based Strike Selection: Finding the Right Risk-Reward Balance
Delta measures the probability that an option will expire in the money. A 30-delta call has approximately a 30% chance of being assigned at expiration. A 16-delta call has roughly a 16% chance. For covered call writers, delta is the primary tool for balancing premium income against assignment risk.
The 16-delta strike is the institutional standard for income-focused covered calls. At this level, you have an 84% statistical probability of keeping the stock while still collecting meaningful premium. The 30-delta strike pays more but carries a 30% assignment probability, which matters if you want to hold the stock long-term.
Your delta choice should reflect your outlook. If you are neutral to slightly bullish, the 16-20 delta range maximizes income while preserving upside participation. If you are neutral to slightly bearish, the 30-40 delta range collects more premium and provides a larger buffer against downside moves.
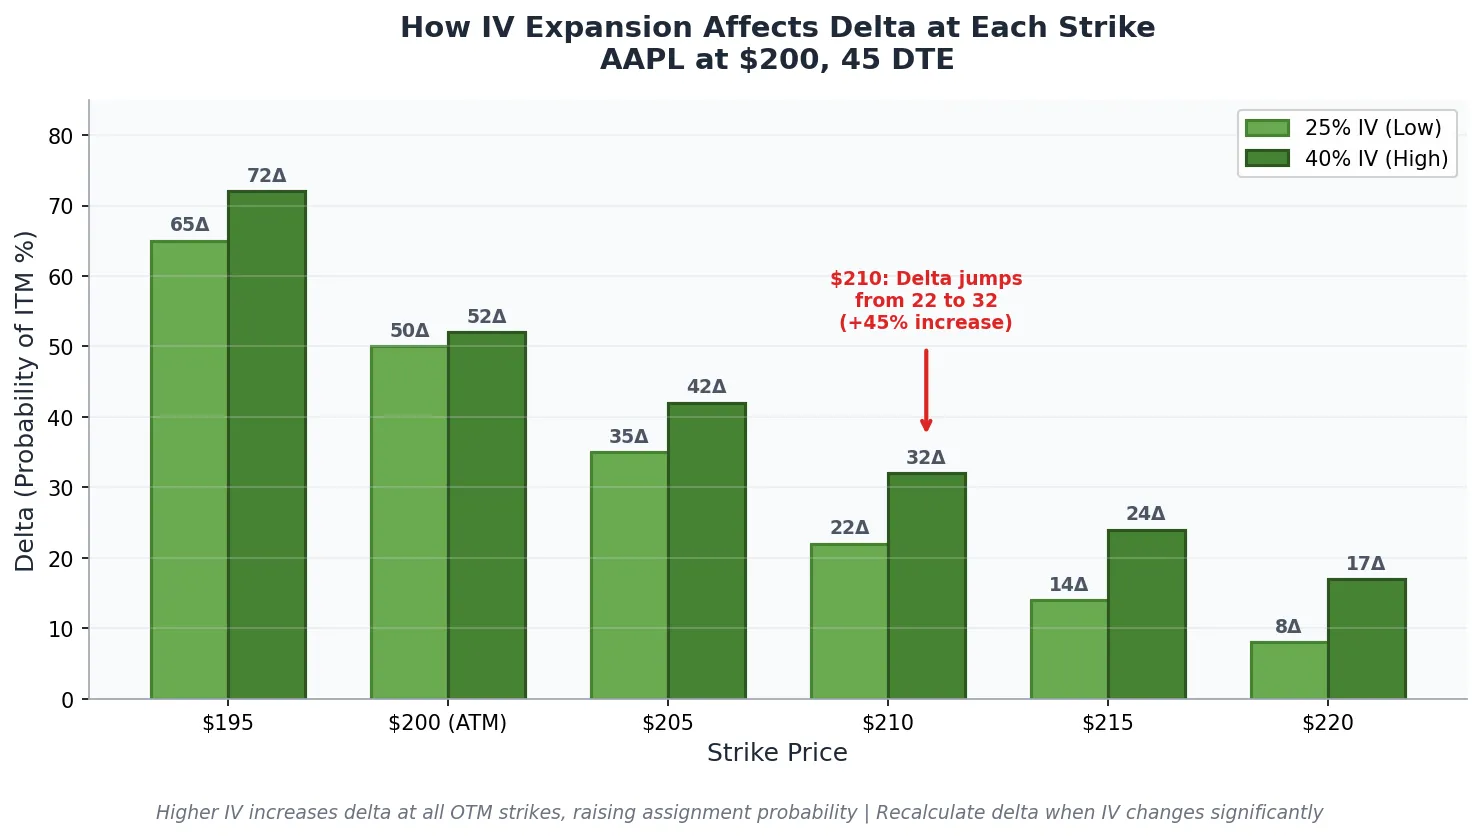
How IV Affects Delta at the Same Strike
Here is where volatility and delta interact. When IV rises, the delta at a fixed strike increases. A $210 call on AAPL might be 16-delta when IV is at 25%. If IV expands to 40%, that same $210 strike could become 22-delta because the market now expects a wider range of outcomes.
This means you must recalculate your strike selection whenever IV changes significantly. A strike that was appropriately out of the money last week might be uncomfortably close to assignment risk this week if IV has expanded. Always verify delta at entry rather than relying on strike price alone.
The Covered Call Calculator: What to Look For
A covered call calculator should show you three things: maximum profit (premium collected), maximum loss (stock purchase price minus premium), and breakeven (stock purchase price minus premium). However, a useful calculator goes further by incorporating volatility data.
The key metrics to evaluate:
- Premium as % of stock price: This normalizes the premium across different stock prices. A $2 premium on a $50 stock (4%) is better than a $3 premium on a $200 stock (1.5%).
- Annualized return if flat: What you earn if the stock closes exactly at your entry price. This is pure theta capture.
- Annualized return if called: Your total return including capital appreciation if the stock reaches your strike and you are assigned.
- Downside protection %: How much the stock can decline before you lose money. This equals the premium divided by the stock price.
- Expected move vs strike distance: Is your strike inside or outside the 1-SD expected move?
The best covered call calculators also display IV rank or IV percentile alongside these metrics. Without volatility context, you cannot know whether the premium you are evaluating is historically attractive or below average for that stock.
How to Select Covered Call Strikes in Different IV Environments
Your strike selection strategy should adapt to the current volatility regime. Here is how to approach each environment:
High IV Environment (IV Percentile Above 70)
High IV is the best time to write covered calls. Premium is elevated across all strikes, so you can sell further out of the money while still collecting attractive income. The strategy: widen your strike selection by 1-2 standard deviations compared to normal.
Example: If you normally sell 30-delta calls, consider the 20-delta strike when IV is elevated. You collect similar absolute premium but give away less upside. This approach lets you participate in larger rallies while still generating income from the volatility premium.
High IV also means the stock is pricing in potential large moves. Check for upcoming catalysts (earnings, FDA decisions, product launches) that might cause the IV to be justified. If the elevated IV reflects an imminent event, consider shorter-duration covered calls that expire before the catalyst.
Normal IV Environment (IV Percentile 30-70)
In normal conditions, standard strike selection rules apply. Target the 16-30 delta range based on your outlook. Use the expected move calculation to verify that your strike is outside the 1-SD range. Accept that returns will be average but consistent.
The key discipline in normal IV environments is patience. Do not chase premium by selling too close to the money. The marginal extra income is not worth the increased assignment probability. Stick to your delta targets and let compounding work over multiple cycles.
Low IV Environment (IV Percentile Below 30)
Low IV creates a dilemma. Premium at your normal strikes may not justify the trade after commissions. You have three options:
- Wait. Cash sits idle, but you preserve optionality for when IV returns to normal levels.
- Sell closer to the money. Accept higher assignment risk in exchange for meaningful premium. This works if you would be comfortable selling the stock at the strike price.
- Extend duration. Sell 60-75 DTE options instead of 30-45 DTE. Longer duration captures more time value and partially compensates for low IV. The tradeoff is reduced flexibility and more exposure to directional moves.
Low IV periods often precede volatility expansions. The Market Pulse tool tracks regime transitions that can signal when a low-volatility environment is likely to shift.
Covered Call Strike Selection by Days to Expiration
Time to expiration affects both premium size and theta decay rate. Shorter durations (7-21 DTE) offer faster theta decay but require more frequent management. Longer durations (45-60 DTE) capture more absolute premium per trade but tie up capital longer.
| DTE Range | Premium % | Theta Decay Rate | Management Frequency | Best For |
|---|---|---|---|---|
| 7-14 DTE | Low (0.5-1.5%) | Very fast | Weekly | Active traders, high conviction strikes |
| 21-30 DTE | Medium (1.5-2.5%) | Fast | Bi-weekly | Balance of decay and flexibility |
| 45-60 DTE | Higher (2.5-4%) | Moderate | Monthly | Income focus, less active management |
| 75-90 DTE | Highest (3.5-5%) | Slow initially | Quarterly | Leaps on core holdings |
The institutional approach is to sell 45-day options and close at 21 DTE or 50% profit, whichever comes first. This captures the steepest part of the theta decay curve while avoiding the gamma risk that accelerates in the final two weeks before expiration.
In high IV environments, shorter durations (21-30 DTE) become more attractive because elevated IV inflates premiums even at reduced time to expiration. In low IV environments, extending to 60+ DTE helps compensate for compressed premiums.
Calculating Your True Annualized Return on Covered Calls
Annualized return is the correct metric for comparing covered call strategies across different stocks, strikes, and durations. Raw premium numbers are misleading because they do not account for capital deployed or time in the trade.
Annualized Return (if flat) = (Premium / Stock Price) x (365 / DTE) x 100
Annualized Return (if called) = ((Premium + Strike – Stock Price) / Stock Price) x (365 / DTE) x 100
Example: Stock at $100, 30-delta call at $105 strike for $2.50 premium, 45 DTE
If flat: ($2.50 / $100) x (365/45) x 100 = 20.3% annualized
If called: (($2.50 + $105 – $100) / $100) x (365/45) x 100 = 60.8% annualized
The “if called” return looks impressive but is capped. You cannot earn more than that amount even if the stock rallies significantly past your strike. The “if flat” return is your baseline expectation for a neutral outcome. Compare this number across candidates to identify which covered calls offer the best risk-adjusted income.
Target a minimum annualized return (if flat) of 10-15% for individual stock covered calls and 6-10% for ETF covered calls. Below these thresholds, the premium does not adequately compensate for the opportunity cost of capping upside and the administrative burden of managing the position.
Common Covered Call Mistakes That Cost Traders Money
The most expensive covered call mistakes relate to volatility misunderstanding and strike selection errors. Here are the patterns that consistently destroy returns:
Selling in Low IV Without Adjusting
Writing covered calls when IV percentile is below 30 without adjusting strike or duration produces mediocre returns. The premium collected barely covers commissions on a risk-adjusted basis. Either wait for IV to normalize or accept the higher delta required to generate meaningful income.
Ignoring Earnings and Events
IV spikes before earnings announcements. That elevated premium looks attractive, but it exists because the stock might gap 10%+ overnight. Selling covered calls into earnings without understanding the expected move often results in assignment at an inopportune price or whipsaw moves that negate multiple months of income.
Check the earnings calendar before every covered call entry. If earnings fall within your option’s expiration window, either close the position before the announcement or accept the binary risk.
Selling Too Close to the Money for Extra Premium
The 45-delta and 50-delta strikes pay more than the 20-delta strike. They also get assigned 2-3x more frequently. If your goal is to hold the underlying stock long-term, selling near the money defeats the purpose. You will be assigned, repurchase at a higher price, and pay taxes on the capital gain.
The marginal premium from selling closer to the money rarely compensates for the frequency of unwanted assignment. Stick to your target delta range unless you genuinely want to exit the position.
Never Rolling or Managing
Covered calls require active management. When the stock rallies toward your strike, you have options: let it assign, roll up and out for a credit, or close the call and reassess. Passive holding until expiration leaves money on the table in trending markets.
The standard management rule: close covered calls at 50% of maximum profit or 21 DTE, whichever comes first. This captures the majority of available theta while freeing capital for the next opportunity.
Rolling Covered Calls: When and How to Extend Your Position
Rolling a covered call means closing the current short call and opening a new one at a later expiration, often at a higher strike. This technique extends your income stream while potentially increasing your upside participation.
Roll when these conditions exist:
- The stock approaches your strike with time remaining. If you are 10+ days from expiration and the stock is within 2% of your strike, rolling up and out captures additional premium while raising your effective cap.
- IV has increased since entry. Rolling during an IV spike lets you collect more premium than your original position, sometimes enough to roll to a higher strike for a net credit.
- You want to keep the stock. Rolling is assignment avoidance. If you want to hold the stock long-term, rolling is preferable to assignment and repurchase.
The mechanics: buy to close your current short call, then sell to open a new call at a later expiration. Target a net credit for the roll. If you must pay a debit to roll, the roll only makes sense if you are also moving to a significantly higher strike that increases your upside potential.
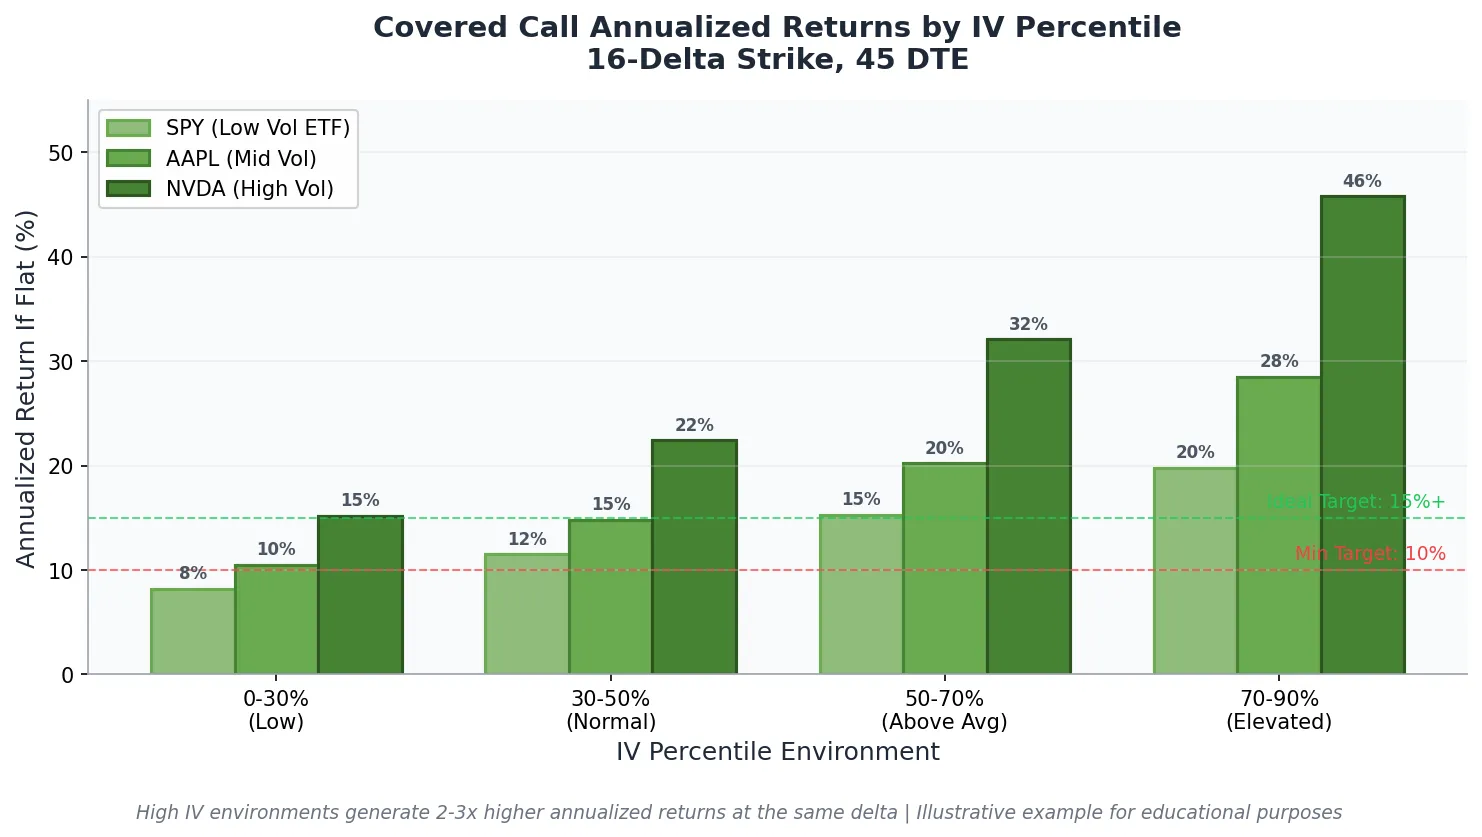
Backtested Covered Call Performance by IV Environment
Historical data from the Volatility Box backtester shows consistent patterns for covered call performance across IV regimes. These findings inform optimal strike selection:
Covered calls written at IV percentile above 70 outperformed those written below 30 by an average of 2.3% per cycle (roughly 45 days) across a 10-year sample on SPY. The outperformance came from two sources: higher absolute premium collected and a lower frequency of assignment due to the ability to sell wider strikes.
The 16-delta strike showed a 78% win rate (options expiring worthless or closed profitably) across all IV environments. The 30-delta strike showed a 65% win rate but higher average dollar profit per winning trade. Risk-adjusted returns favored the 16-delta approach for income-focused investors.
Covered calls on individual stocks showed higher variance than ETF covered calls. The elevated premium on single stocks came with elevated assignment frequency and occasional large adverse moves. Diversifying across 5-10 positions reduced the impact of any single stock’s outlier behavior.
Building a Volatility-Aware Covered Call System
A systematic covered call approach removes emotion from strike selection and timing. Here is a framework based on volatility data:
- Screen for IV percentile above 50. Only consider covered calls on stocks where current IV exceeds the median for that stock.
- Calculate the expected move. Use the straddle price to determine the 1-SD range for your chosen expiration.
- Select strike at or beyond 1 SD. Target the strike closest to the expected move upper bound while staying at or below 20 delta.
- Verify annualized return. Require a minimum 12% annualized return (if flat) before entering the trade.
- Check the calendar. Confirm no earnings or major events fall within the option’s life.
- Manage at 50% profit or 21 DTE. Close the position when either threshold is reached, then reassess for a new entry.
This system produces consistent income while avoiding the common pitfalls of selling in low-IV environments or ignoring event risk. The Volatility Scanner automates steps 1-2 by displaying IV percentile and expected move data for every symbol in real time.
Key Takeaways
- IV percentile above 50 is the minimum threshold for attractive covered call entries. Above 70 is the sweet spot for elevated premium without excessive event risk.
- The expected move calculation (straddle x 0.85) defines the 1-SD range. Strikes beyond this level have approximately 84% probability of expiring worthless.
- The 16-20 delta range balances income and assignment risk for long-term stockholders. The 30 delta range suits traders willing to accept higher assignment frequency for more premium.
- Annualized return (if flat) should exceed 10-15% for individual stocks and 6-10% for ETFs to justify the trade after opportunity cost.
- Close covered calls at 50% profit or 21 DTE, whichever comes first. This captures theta while freeing capital for the next cycle.
- Rolling up and out during IV spikes lets you raise your strike while collecting additional premium. Only roll for a net credit unless the strike improvement is substantial.
- Covered calls written in high IV environments outperform those written in low IV by approximately 2.3% per cycle based on backtested data.
Find High-IV Covered Call Candidates in Real Time
The Volatility Scanner ranks 595 symbols by IV percentile and displays expected move data for every expiration. Filter for stocks in your portfolio, sort by IV percentile, and identify which positions offer the most attractive premium for your next covered call.
Frequently Asked Questions
Related Research
Iron Condor in High Volatility: When to Sell, How Wide, and How to Manage
Iron condors collect 2-3x premium when VIX is above 25. Learn wing width rules, delta targets, position sizing, and management…
How to Trade the VIX: Complete Strategy Guide for 2026
Trade VIX using futures, options, and ETFs. 5 backtested strategies with entry/exit rules, risk management, and regime filters. Data from…
0DTE Options and Volatility: The Complete Day Trading Guide
0DTE options now represent 59% of SPX volume. Learn theta decay timing, gamma effects, VIX1D signals, and position sizing for…
Stop guessing. Start using data.
600+ symbols. Updated every 2 minutes. Backtested methodology since 2008.
Try the Scanner