IV Percentile Explained: Why PG at 28% IV Is More Volatile Than AAPL at 32%
PG has lower IV than AAPL but higher IV Percentile. Raw IV is meaningless without context. Learn what IV Percentile measures, how it differs from IV Rank, and how to use it for trade selection.
- Raw IV Tells You Nothing by Itself
- What IV Percentile Measures
- PG at 55%: A Stock Running Hot for Itself
- AAPL at 24%: Higher IV, Cheaper Options
- The Trade Decision IV Percentile Changes
- Why IV Percentile Beats IV Rank After Spikes
- Real-World Examples
- When IV Rank Still Matters
- Using IV Percentile for Trade Selection
- How to Find IV Percentile
- Common Mistakes with IV Percentile
- How Volatility Box Uses IV Percentile
Procter & Gamble has implied volatility of 27.91%. Apple has implied volatility of 31.90%. Which stock has more expensive options relative to normal? If you said Apple, you are wrong. PG’s IV Percentile reads 55%. Apple’s reads 24%. PG options are priced at the upper half of their yearly range. Apple options are near the bottom. The stock with lower raw IV is actually the more volatile one right now, relative to its own history. This is what IV Percentile measures, and why it matters more than the number your broker shows you on the options chain.
Published March 13, 2026
Raw IV Tells You Nothing by Itself
Every options chain shows an implied volatility number. AAPL at 31.90%. PG at 27.91%. Traders glance at these numbers and assume AAPL options are “more expensive.” That assumption costs money.
Implied volatility is relative. AAPL’s 52-week IV range runs from 19.5% to 71.2%, pulled wide by quarterly earnings spikes. Current IV at 31.90% sits near the bottom of that range. PG’s 52-week IV range is 15.8% to 37.8%. Current IV at 27.91% sits right in the middle.
Selling premium on AAPL at 31.90% IV means you are collecting cheap premium relative to what AAPL typically offers. Selling premium on PG at 27.91% IV means you are collecting premium that is richer than usual for PG. The raw IV number obscures this completely.
IV Percentile strips away the noise. It answers one question: what percentage of trading days over the past year had lower IV than today?
What IV Percentile Measures
IV Percentile = (Number of Days with IV Below Current IV) / (Total Trading Days in Period) × 100
Over a standard 252-trading-day lookback, IV Percentile counts how many days had IV lower than today’s level. If 139 out of 252 days had lower IV, IV Percentile is 55%. If only 60 days had lower IV, it is 24%.
The metric does not care about extremes. It does not care if IV spiked to 100% for three days during earnings. It treats every trading day equally. A one-week spike represents 5 out of 252 observations. It cannot dominate the reading.
This is what makes IV Percentile useful for trade selection: it tells you how current IV compares to typical IV, not to a single outlier high or low.
PG at 55%: A Stock Running Hot for Itself
PG’s current implied volatility is 27.91%. That number means nothing in isolation. What matters: PG’s IV Percentile reads 55%. Current IV is higher than 55% of all trading days over the past year.
52-week IV range: 15.8% to 37.8%
Current IV: 27.91%
IV Percentile: 55% — higher than the majority of trading days
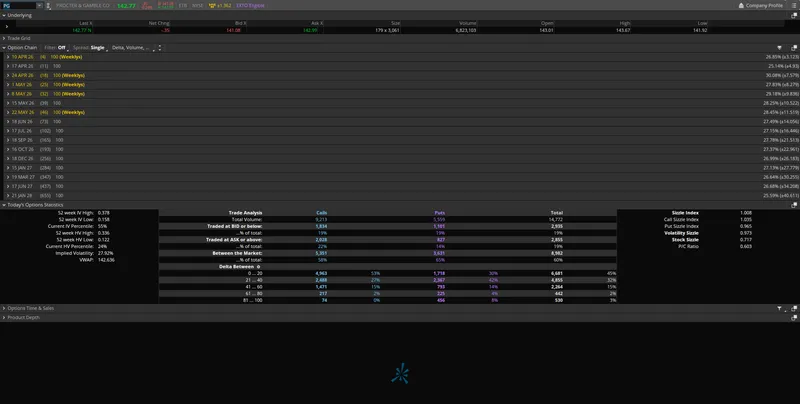
PG is a consumer staple. It does not spike like a tech stock. Its IV range is narrow. So when IV creeps above the midpoint of its historical distribution, that is meaningful. An IV Percentile of 55% on PG represents a genuine shift toward more expensive options relative to what this stock normally offers. A covered call or short put here collects better-than-average premium.
AAPL at 24%: Higher IV, Cheaper Options
AAPL’s current implied volatility is 31.90%. Higher than PG. But AAPL’s IV Percentile reads just 24%. Current IV is only higher than 24% of trading days. For three-quarters of the past year, AAPL had IV above 31.90%.
52-week IV range: 19.5% to 71.2%
Current IV: 31.90%
IV Percentile: 24% — lower than most of the past year
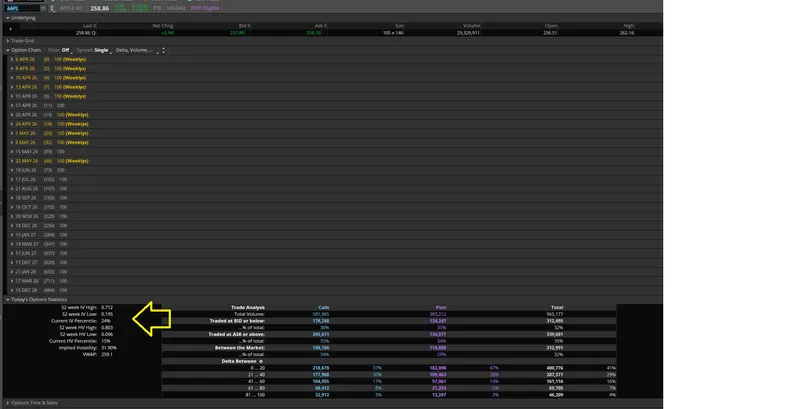
AAPL reports earnings every quarter. Each cycle pushes IV toward 50-70%. Between cycles, IV compresses back to the 20-35% range. Current IV at 31.90% is between earnings. The 71.2% high from the last cycle stretches the range, but IV Percentile ignores that distortion because it counts every day equally. The reading of 24% tells you plainly: AAPL options are cheap relative to what this stock normally offers.
Selling premium on AAPL right now means collecting below-average premium. Buying options means getting them at a discount to typical levels. The raw IV of 31.90% hides both of these facts.
The Trade Decision IV Percentile Changes
Without IV Percentile, a trader scanning both stocks sees PG at 27.91% IV and AAPL at 31.90% IV and gravitates toward selling premium on AAPL because the number is higher. That trader collects below-average premium on a stock in a low-IV phase and ignores above-average premium on PG.
With IV Percentile:
| Stock | Current IV | IV Percentile | 52-Week IV Range | Signal |
|---|---|---|---|---|
| PG | 27.91% | 55% | 15.8% – 37.8% | Above-average premium. Sell premium strategies have an edge. |
| AAPL | 31.90% | 24% | 19.5% – 71.2% | Below-average premium. Buying strategies or waiting is better. |
The stock with lower raw IV is the better premium-selling candidate. IV Percentile makes this visible. Raw IV does not.
Why IV Percentile Beats IV Rank After Spikes
IV Percentile is not the only metric that contextualizes IV. IV Rank does the same thing, differently. The formula:
IV Rank = (Current IV – 52-Week IV Low) / (52-Week IV High – 52-Week IV Low) × 100
IV Rank uses only three data points: the current IV, the 52-week high, and the 52-week low. It tells you where current IV sits between the extremes. For PG and AAPL right now, IV Rank and IV Percentile happen to agree: PG shows 55 on both, AAPL shows 24 on both.
They agree because neither stock has had a recent one-off spike that distorts the range. When spikes happen, the two metrics diverge, and IV Percentile gives the more accurate reading.
How a Spike Breaks IV Rank
Take a stock that normally trades with IV between 22% and 35%. During a single week of panic selling, IV spikes to 85%. Three months later, IV settles back to 32%, near the top of the normal range.
IV Rank = (32 – 22) / (85 – 22) × 100 = 15.9
IV Rank reads 15.9. A trader screening for IV Rank above 50 skips this stock.
Of 252 trading days, ~215 had IV below 32%.
IV Percentile ≈ 85
IV Percentile reads 85. Current IV is higher than 85% of all trading days. The spike lasted 5 days out of 252. It cannot dominate a metric that weights every day equally.
IV Rank stays compressed for up to 12 months after a spike until the extreme reading exits the lookback window. IV Percentile self-corrects within days. This is why IV Percentile is the more reliable metric for trade selection, especially on stocks with earnings spikes, crisis events, or any single outlier in the past year.
Real-World Examples
COVID crash, 2020. SPY implied volatility peaked near 82% in March. By Q2 and Q3, VIX had fallen to the mid-20s but remained well above the pre-COVID baseline of 12-15%. IV Rank read below 25 for months because the March spike anchored the top of the range. IV Percentile correctly showed readings above 70 because IV was still higher than the vast majority of pre-crash observations. Traders relying on IV Rank missed months of elevated premium.
Regional bank crisis, March 2023. After SVB, Signature Bank, and First Republic collapsed, bank stocks like KRE and XLF saw IV spikes. For 12 months afterward, IV Rank on these names read artificially low. IV Percentile flagged them as elevated. Traders who filtered by IV Rank alone sat out a full year of premium-selling opportunity.
When IV Rank Still Matters
IV Rank is not useless. In stable volatility environments without recent extremes, it gives similar readings to IV Percentile and is simpler to calculate. You only need three numbers from any broker screen.
Gradual IV expansion. When IV rises steadily over weeks, IV Rank responds immediately. IV Percentile needs more days to accumulate before the count shifts.
Compressed IV regimes. In extended low-volatility periods like 2017, IV Percentile can stay elevated because current low IV is still above even lower readings from earlier. IV Rank correctly shows IV is near the bottom of its range.
Quick screening. If you are scanning 50 stocks and need a fast read, IV Rank from a broker screen gets you 80% of the way. Just verify with IV Percentile on any stock that had a spike in the past year.
The practical approach is to use both. When they agree (PG at 55/55, AAPL at 24/24), the signal is clean. When they disagree by more than 30 points, a spike is distorting IV Rank and IV Percentile is the one to trust.
Using IV Percentile for Trade Selection
Premium Selling: IV Percentile Above 50
When IV Percentile reads above 50, current IV is higher than the majority of the past year. Options are priced above average for that stock. Strategies that benefit: covered calls, cash-secured puts, credit spreads, iron condors, strangles.
PG at IV Percentile 55% is a candidate. AAPL at 24% is not.
Premium Buying: IV Percentile Below 30
When IV Percentile reads below 30, current IV is near the bottom of its yearly distribution. Options are cheap for that stock. Strategies that benefit: long calls, long puts, debit spreads, long straddles, calendar spreads.
AAPL at IV Percentile 24% is a candidate for buying strategies or waiting for IV to expand before selling.
The Dual-Filter Rule
For premium selling, require both IV Percentile above 50 and IV Rank above 30:
Sell premium when:
• IV Rank > 30 AND
• IV Percentile > 50
If IV Rank is compressed by a spike, the IV Percentile threshold still catches genuinely elevated IV. If IV Percentile is slow to respond to a new trend, IV Rank picks up the slack. The Volatility Box scanner flags divergences automatically across 611 tracked symbols.
Thresholds by Strategy
| Strategy | IV Rank Target | IV Percentile Target | Logic |
|---|---|---|---|
| Short iron condor | >50 | >50 | Needs inflated premium for credit cushion |
| Short strangle | >50 | >60 | Undefined risk requires strong IV signal |
| Short put (cash-secured) | >30 | >40 | Directional bias allows lower threshold |
| Earnings iron condor | >70 | >80 | IV crush is the primary edge |
| Long straddle | <30 | <30 | Cheap IV means cheap entry for vol expansion bet |
| Long strangle | <30 | <35 | Wide strikes need even cheaper premium |
| Calendar spread | <40 | <40 | Benefits from IV expansion; enter low |
| Diagonal spread | <50 | <50 | Long back-month leg benefits from IV rise |
| Credit spread (vertical) | >40 | >45 | Lower threshold than iron condor |
How to Find IV Percentile
On Thinkorswim
Go to the Trade tab, select your symbol, and look at Today’s Options Statistics. IV Percentile is displayed by default. Note: Schwab’s documentation sometimes describes this metric ambiguously. The value shown on Thinkorswim is a true percentile calculation (day count), not IV Rank (range position).
On Other Platforms
| Platform | IV Percentile | IV Rank | Notes |
|---|---|---|---|
| Thinkorswim | Yes (Trade tab → Today’s Options Statistics) | No (requires thinkScript) | Schwab docs sometimes describe this ambiguously |
| Tastytrade | No | Yes (labeled “IVR”) | “IVR” is IV Rank, not Percentile |
| Volatility Box | Yes | Yes | Both with divergence alerts |
| OptionStrat | Yes | Yes | Strategy builder |
| Barchart | Yes (Options → IV Percentile) | No | 52-week lookback |
| IBKR / TWS | No (requires API) | No (requires API) | Calculate from historical data |
| Fidelity | No | No | Raw IV only |
| E*TRADE | Partial | No | IV vs average, not exact percentile |
Calculate It Yourself
- Export 252 trading days of closing IV data from your broker
- Count days with IV below current: =COUNTIF(A2:A253, “<” & CurrentIV)
- Divide by total days: =COUNTIF(A2:A253, “<” & CurrentIV) / 252 * 100
ThinkOrSwim thinkScript for IV Rank
If you want IV Rank alongside Thinkorswim’s built-in IV Percentile, add a custom watchlist column:
def ivHigh = Highest(imp_volatility(), 252);
def ivLow = Lowest(imp_volatility(), 252);
def ivRank = (imp_volatility() – ivLow) / (ivHigh – ivLow) * 100;
plot IVR = ivRank;
Common Mistakes with IV Percentile
Comparing IV Percentile Across Stocks
IV Percentile of 55% on PG and 24% on AAPL does not mean PG is “more volatile.” It means PG is more volatile relative to itself. Each reading is anchored to that stock’s own IV history. Cross-stock comparisons require looking at the raw IV ranges, not just the percentile readings.
Ignoring IV Percentile Because Raw IV “Looks Low”
PG at 27.91% IV looks unremarkable. Most traders scan right past it. But 55% IV Percentile says this is above average for PG. The premium-selling opportunity is real, even though the raw number does not jump off the screen.
Treating IV Rank and IV Percentile as the Same Thing
Social media and even some broker documentation use these terms interchangeably. They are different calculations. They agree most of the time but diverge after spikes. When they disagree by 30+ points, IV Rank is usually the distorted one.
Selling Premium at Low IV Percentile
AAPL at IV Percentile 24% is a premium-buying environment, not a premium-selling one. Selling covered calls or short puts here collects below-average premium. If IV expands back to typical levels, short premium positions lose.
How Volatility Box Uses IV Percentile
The Volatility Box scanner displays IV Percentile alongside IV Rank for all 611 tracked symbols. Both feed into the Conviction Score algorithm, which also weighs realized volatility, trend direction, and market regime.
When IV Rank and IV Percentile diverge by more than 30 points, the scanner flags the symbol with a “Divergence” alert. This prevents trades entered on a distorted IV Rank signal when IV Percentile tells a different story.
Key Takeaways
- Raw implied volatility is meaningless without context. AAPL at 31.90% IV is cheaper than PG at 27.91% IV relative to each stock’s own history.
- IV Percentile tells you what percentage of trading days over the past year had lower IV than today. It uses all 252 observations equally.
- IV Percentile above 50 means options are priced above average for that stock. Below 30 means they are cheap.
- IV Rank uses only the 52-week high and low. It agrees with IV Percentile in stable environments but gets distorted by spikes for up to 12 months.
- When IV Rank and IV Percentile disagree, trust IV Percentile.
- Dual-filter rule for premium selling: IV Rank > 30 AND IV Percentile > 50.
- Platform labels are inconsistent. Tastytrade’s “IVR” is IV Rank. Thinkorswim shows IV Percentile. Always verify which calculation your broker uses.
Screen 611 Symbols by IV Percentile
The Volatility Box scanner displays IV Percentile and IV Rank for every tracked symbol, flags divergences automatically, and integrates both into the Conviction Score. Find the stocks where IV Percentile says premium is rich, even when raw IV does not look remarkable.
Frequently Asked Questions
Related Research
How to Use Volatility to Select Covered Call Strikes in 2026
Learn how IV percentile and expected move calculations determine optimal covered call strikes. Target 16-20 delta at IV above 50%…
Iron Condor in High Volatility: When to Sell, How Wide, and How to Manage
Iron condors collect 2-3x premium when VIX is above 25. Learn wing width rules, delta targets, position sizing, and management…
How to Trade the VIX: Complete Strategy Guide for 2026
Trade VIX using futures, options, and ETFs. 5 backtested strategies with entry/exit rules, risk management, and regime filters. Data from…
Stop guessing. Start using data.
600+ symbols. Updated every 2 minutes. Backtested methodology since 2008.
Try the Scanner