FAIL: error: no such post
The Volatility Box is built on one idea: project the zones where a move is statistically stretched, then trade the reaction at those zones. This study is the largest proof of that idea we have published.
Every trade below comes from the Dow 30, taken at our aggressive model levels with a symmetric one-R target and stop, from August 2024 through July 2026. No decade-old backtest, no simulation of a market that no longer exists.
This is the recent, live-era record: 13,505 trades.
The design: a coin flip with the zones as the edge
Each trade in the study follows the same skeleton:
- Price reaches an outer level: the L2 or L3 edge of the projected Volatility Box zones.
- The system waits for a retest: after the breach, entry comes only when price returns to the level. No chasing.
- Target and stop are symmetric: exactly one R each, by construction. This is a volatility-adjusted stop mirrored by an equally sized target.
- The exits confirm the symmetry: trades that hit the target averaged +1.01R, trades that hit the stop averaged -1.00R.
That symmetry is the whole point of the design. With an equal target and stop, a strategy with no edge converges to a 50% win rate over thousands of trades.
Whatever it wins above 50% is the measured value of the levels themselves. There is nowhere for an edge to hide in asymmetric payoffs, and nothing for a favorable exit rule to flatter.
The results
| Variant (level and timeframe) | Trades | Win rate | Avg R per trade |
|---|---|---|---|
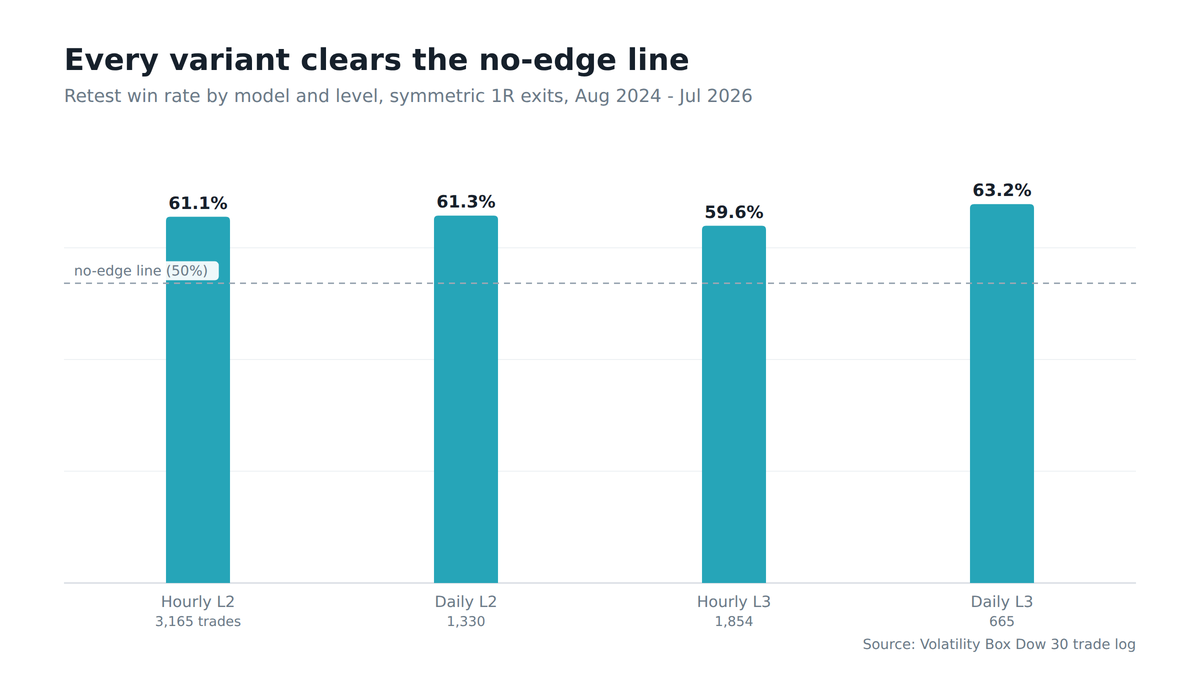
| Hourly model, L2 retest | 3,165 | 61.1% | +0.22 |
| Daily model, L2 retest | 1,330 | 61.3% | +0.23 |
| Hourly model, L3 retest | 1,854 | 59.6% | +0.21 |
| Daily model, L3 retest | 665 | 63.2% | +0.28 |
Those are the four largest long variants. The full study spans 13,505 trades across every variant we track, and the aggregate lands near 61% winners at roughly +0.22R per trade.
Every variant sits meaningfully above the 50% no-edge line, on samples ranging from hundreds to thousands of trades. The deepest zone, the daily L3, is the strongest: reached least often, and paying the best when it is.
The result that surprised us: regime did not matter
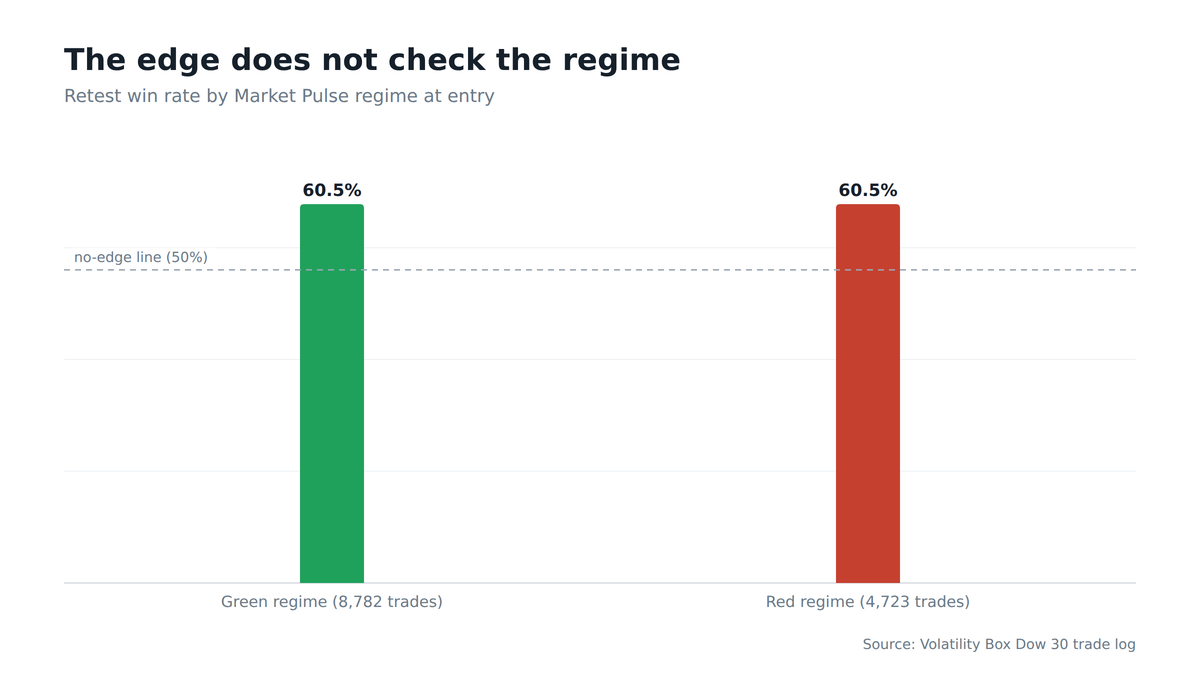
We tagged every trade with the Market Pulse regime at entry, expecting the edge to concentrate in one environment. It did not.
In green regimes the retests won 60.5% of 8,782 trades. In red regimes, 60.5% of 4,723. Identical to the decimal.
In hindsight this is what a volatility edge should look like. The zones are not a trend call; they measure stretch, which is what volatility actually is.
A stock that has traveled to the outer edge of its projected range is statistically extended whether the broader tape is rising or falling, and the snap-back behaves the same way in both. Trend systems need a regime filter. The reaction at the edges, by this measure, does not.
The fine print
Three cautions belong next to the headline:
- +0.22R is an average, not a jackpot: it is the mean across every signal, and it compounds through volume and disciplined position sizing, not through any single trade being large.
- Execution quality matters: the study assumes the retest entry fills and ignores slippage, and a one-R stop on an hourly timeframe is tight enough that intraday execution makes a real difference.
- Two years is the strength and the limit: it is recent, live-era evidence rather than ancient history, but it spans this era’s conditions, not every era’s.
What the record supports is the core claim. The zones are doing measurable work.
At a payoff structure where guessing produces 50%, price reaching our outer levels and retesting has resolved in the trade’s favor about 61 times in 100, across thirteen thousand trades, in both market regimes. That is the edge, quantified.
Frequently asked questions
What was the overall win rate of the Volatility Box retest strategy?
The aggregate landed near 61% winners at roughly +0.22R per trade, measured across every variant tracked. That sits meaningfully above the 50% no-edge line of the symmetric one-R design, so the excess is the measured value of the levels themselves.
Does the Volatility Box edge hold in both rising and falling markets?
Yes: retests won 60.5% of 8,782 trades in green Market Pulse regimes and 60.5% of 4,723 trades in red, identical to the decimal. The zones measure how stretched price is rather than trend direction, so the reaction at the edges behaved the same in both environments.
Which Volatility Box level performed the strongest?
The daily L3, the deepest zone, won 63.2% across 665 trades at +0.28R per trade. It is reached least often but pays the best when it is, outperforming the hourly L2, daily L2, and hourly L3 variants.
How reliable is a retest at the L2 level?
The hourly L2 won 61.1% across 3,165 trades and the daily L2 won 61.3% across 1,330 trades. Both variants averaged roughly +0.22R to +0.23R per trade, well above the 50% breakeven point of the symmetric target and stop.
What did winning and losing trades average in R terms?
Trades that hit the target averaged +1.01R and trades that hit the stop averaged -1.00R. That near-perfect symmetry is by construction: with equal payoffs on both sides, the win rate alone reveals the edge, with no favorable exit rule to flatter it.
What time period does the Dow 30 study cover?
The study covers August 2024 through July 2026, a two-year live-era window rather than a decade-old backtest. Every trade comes from the Dow 30 at the aggressive model levels. The strength is that it is recent evidence; the limit is that it spans this era’s conditions, not every era’s.