Datadog at the edge: how the Volatility Box marked a record-high extreme in $DDOG
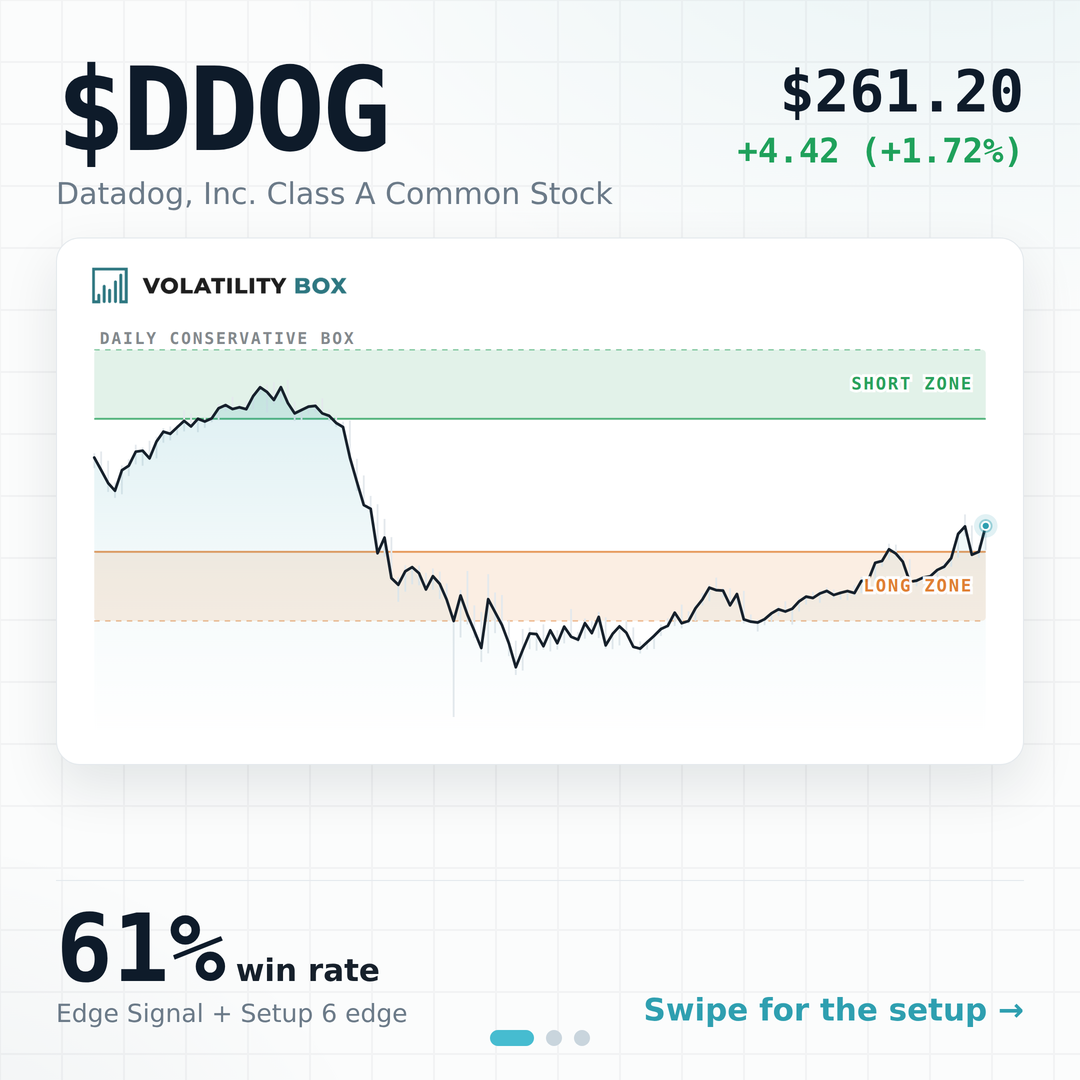
The chase into the edge
Datadog was one of the strongest names on the tape this week. The stock ran to record highs, up roughly 13% in a month, after it acquired Adaptive ML on July 1 to deepen its AI observability research and Benchmark lifted its price target to a Street-high $330 the very next day.
That is exactly the kind of run that carries even a leader to a statistical extreme. On our Daily Conservative model, $DDOG pushed into the upper edge of the Volatility Box, the zone where price is stretched relative to its own recent range, not where the story is wrong.
How the trade set up
Price tagged the L2 level of the Daily Conservative box near $269.69. The Edge Signal confirmed the short there, the target at $267.62 hit 23 minutes later for about 1R, and the stop at $271.77 was drawn before the entry ever fired.
The realized move was small, about 0.8%. That is the point, not a caveat. The Box marks the level and the risk; the Edge Signal takes the entry. You get a defined-risk short with the exit set in advance, and it resolved fast.
The record behind the edge
One trade is a demonstration, not the edge. The edge is the aggregate: the Edge Signal entries taken at the statistical level, measured across the full backtested record, with defined risk on every one.
| Edge trades (Setup 6, backtested) | 13,301 |
|---|---|
| Win rate | 61% |
| Average R per trade | +0.22R |
| Profit factor | 1.57 |
The lesson
A price target tells you where a name might go over the next year. The Box tells you where it is stretched right now. Those two things are not a contradiction, and $DDOG showed why: a Street-high $330 target and a short off the upper edge can both be true on the same chart.
Upper cloud is the fade zone, lower cloud is the long zone. The job is to know which edge you are standing at, and to have the stop and target drawn before you take the trade.