The Volatility Scanner
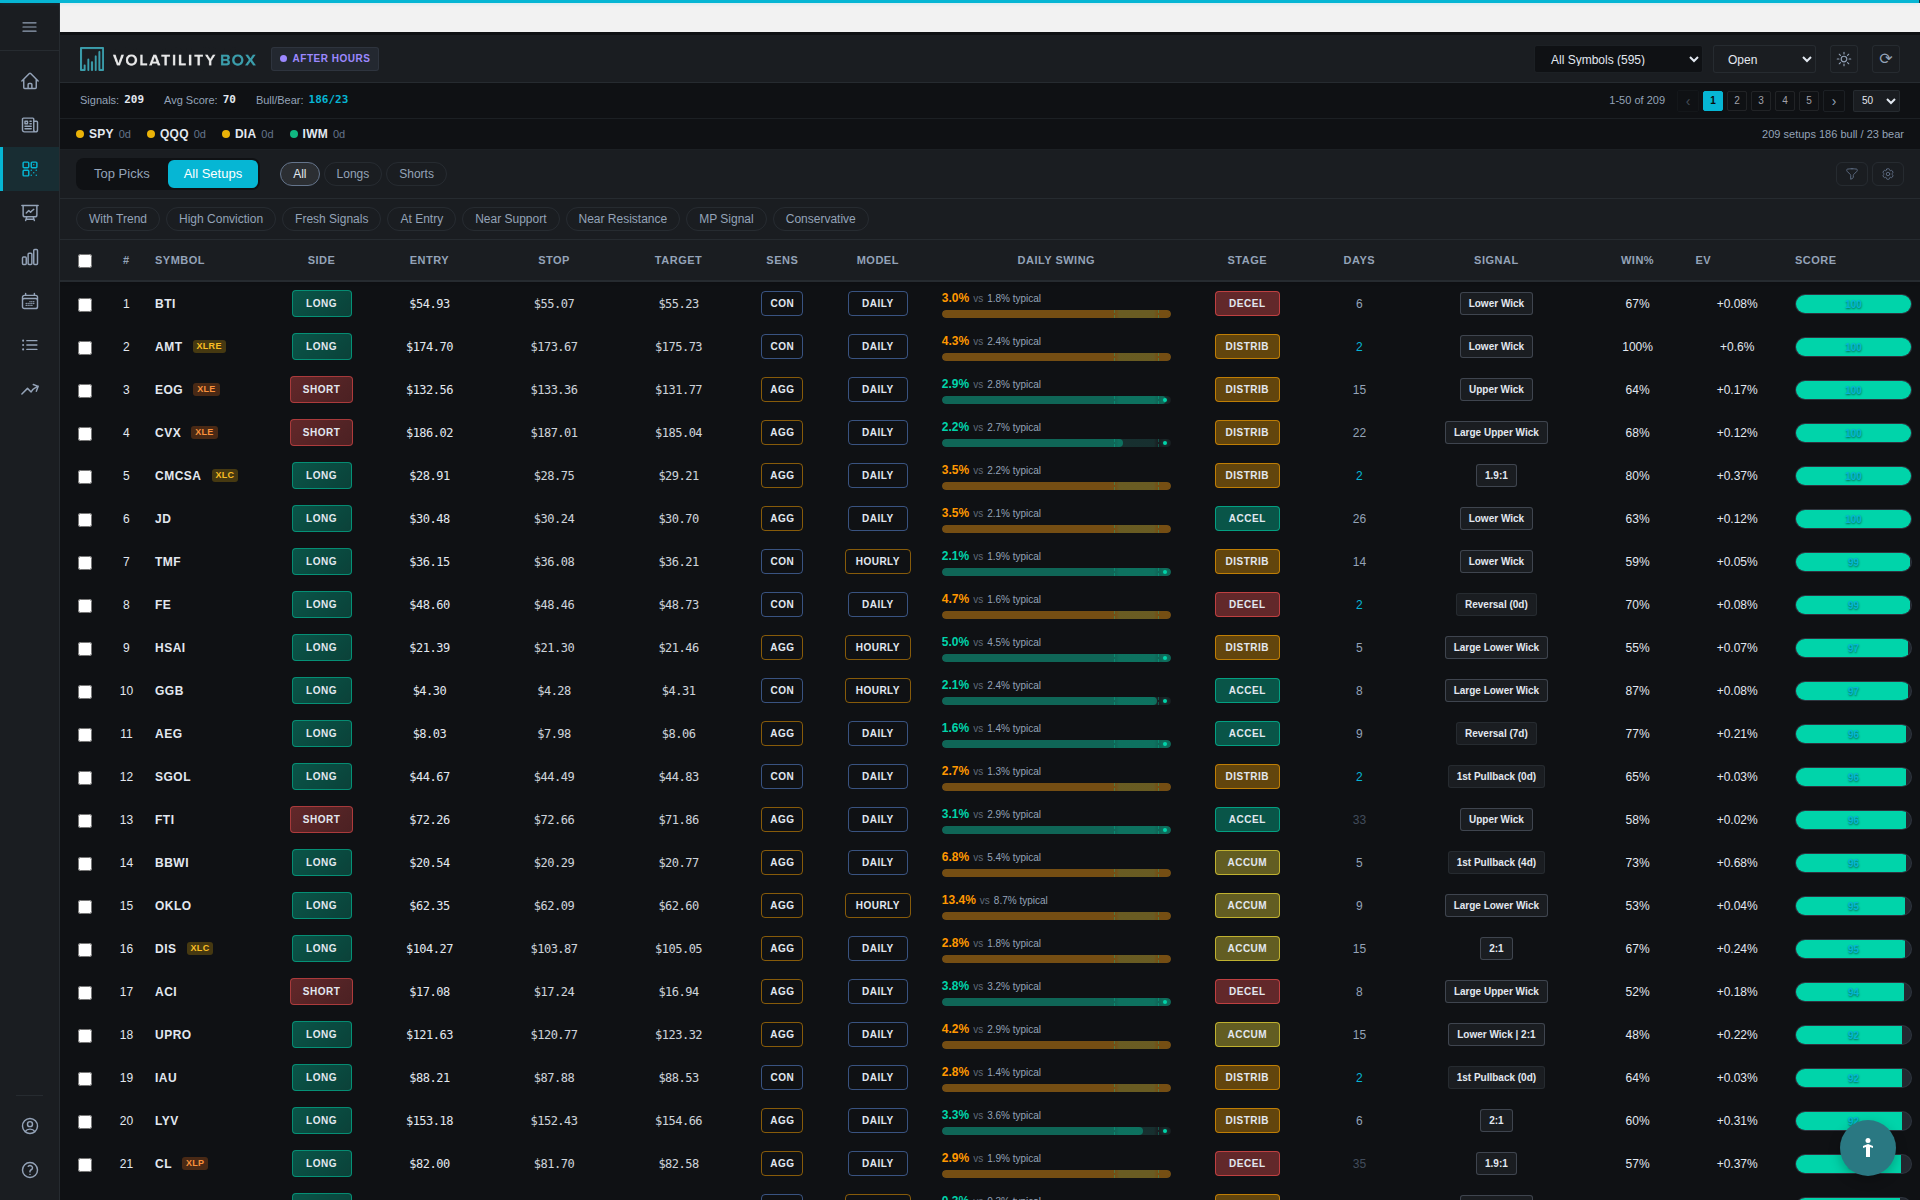
600+ US stocks and ETFs analyzed every two minutes during market hours. Every setup comes with a precise entry, stop, and target price, a conviction score, and the historical win rate from 450+ days of backtested data. Filter by trend, model, sector, conviction level, or build your own view.
From volatility analysis to actionable setups
The scanner is the output of the entire Volatility Box research framework. Here's what happens behind every row of data you see.
Models analyze volatility every 2 minutes
Five proprietary volatility models run against 600+ symbols during market hours. When a statistical mismatch is detected, a setup is generated with precise entry, stop, and target levels calculated from the models.
Every setup is scored and contextualized
The conviction engine scores each setup 0-100 based on win rate, expectancy, Market Pulse alignment, entry proximity, and support/resistance levels. You see the trend context, not just the price levels.
You filter, prioritize, and execute
Use preset filters like "High Conviction" or "With Trend" to surface the setups that match your strategy. Or build custom views with direction, model type, Market Pulse stage, sector, and more.
The best setups, surfaced automatically
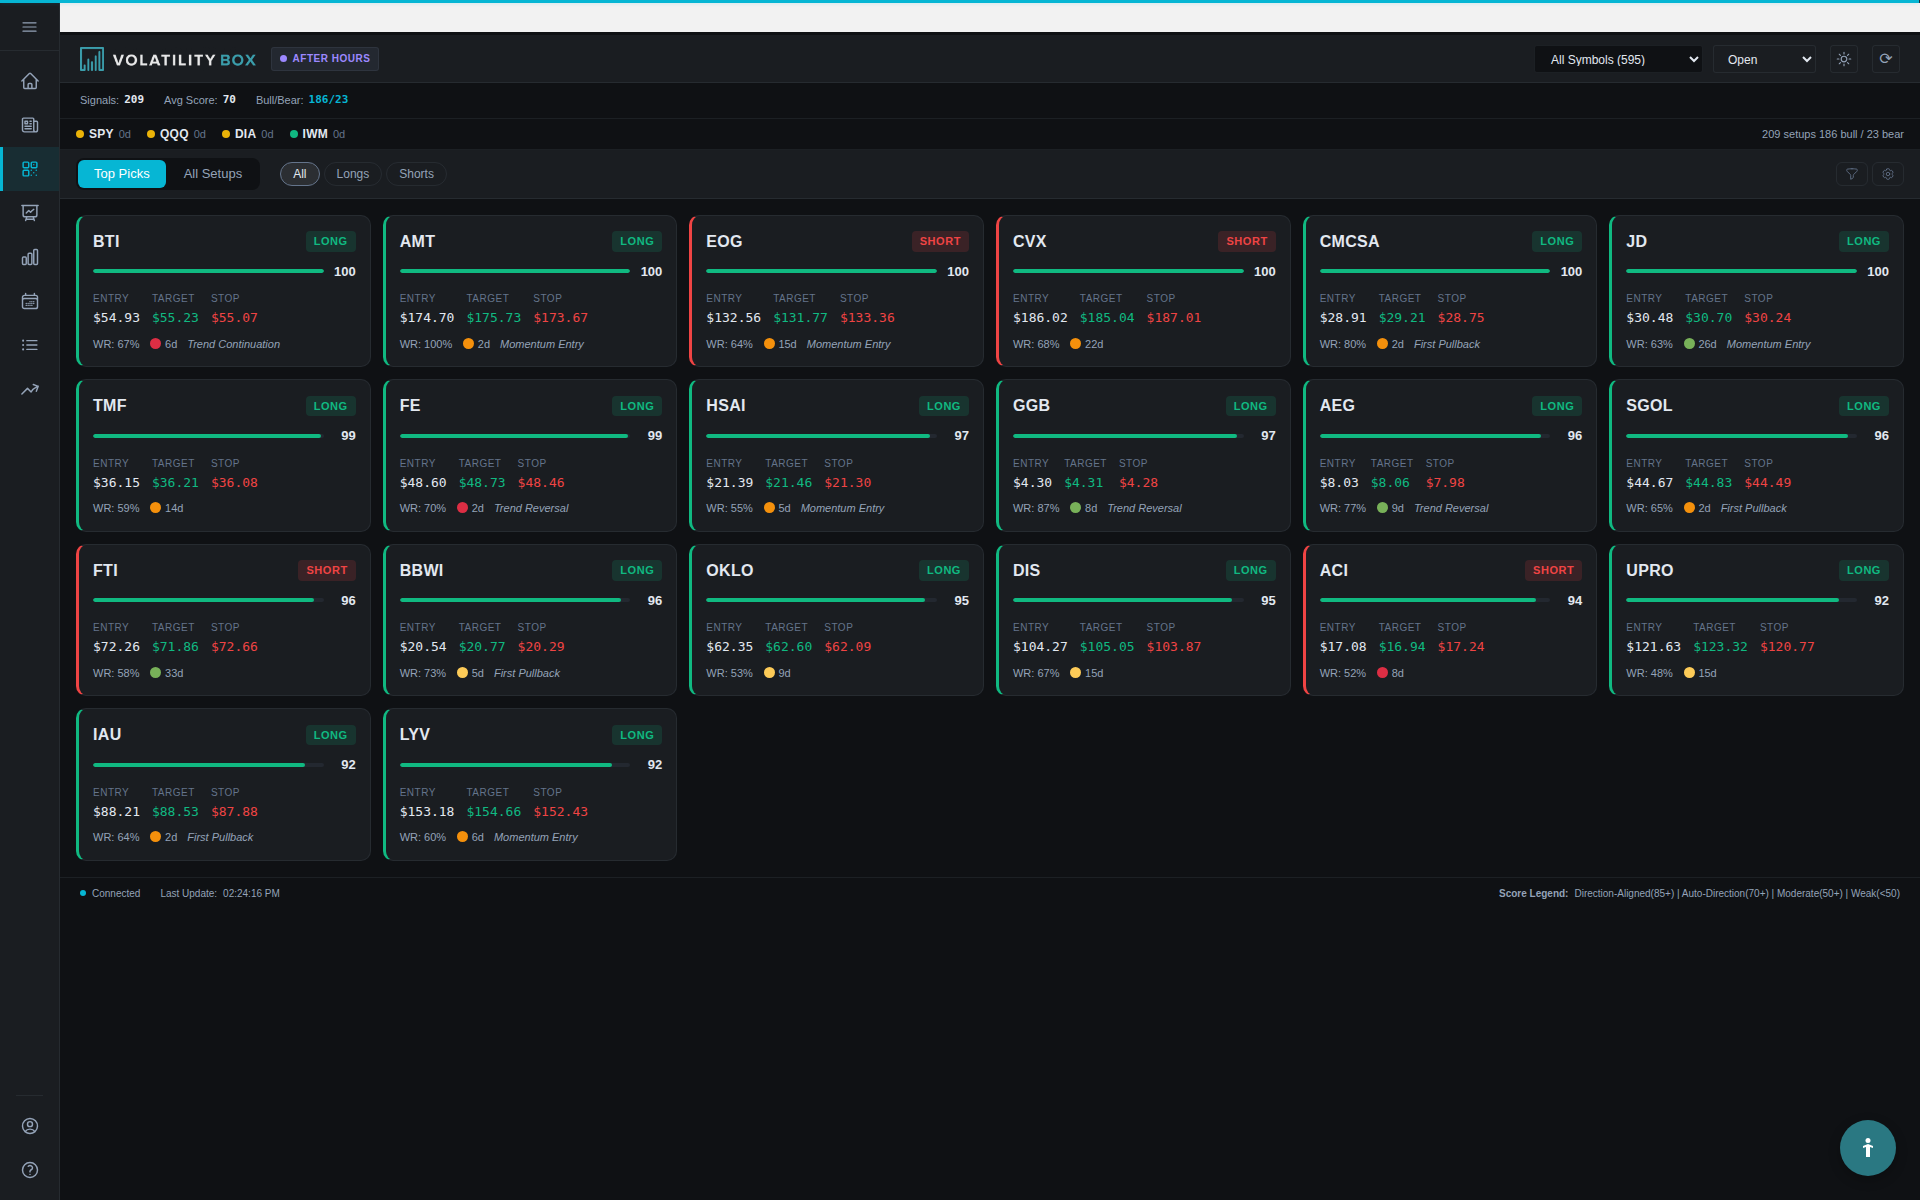
Top Picks shows the highest-conviction setups of the day as a card-based feed, deduplicated by symbol. Instead of scrolling through hundreds of rows, you see the 20 setups where the scoring engine found the strongest confluence of factors.
Filter by direction (All, Longs, Shorts) to narrow the view. Each card shows the symbol, direction, entry/target/stop, score bar, win rate, and Market Pulse phase at a glance.

One-click smart filters
Eight preset filters, each setting multiple parameters at once:
- With Trend Setups aligned with Market Pulse direction
- High Conviction Score 70+
- Fresh Signals Market Pulse signal within 3 days
- At Entry Current price within 0.5% of entry
- Near Support Longs near Darvas support levels
- Near Resistance Shorts near Darvas resistance levels
- MP Signal Any active Market Pulse signal
- Conservative Conservative sensitivity only
See the macro before you trade
The market context strip at the top of the scanner shows SPY, QQQ, DIA, and IWM Market Pulse phases with days in stage. At a glance, you know whether the broad market is in acceleration, accumulation, distribution, or deceleration.
The scanner also shows the bull/bear setup count and average conviction score across all active setups, so you have full market context before choosing which trades to take.

What the data shows
Historical performance across all scanner setups, broken down by model type and Market Pulse alignment.
Win Rate by Model
Win Rate by Market Pulse (Aligned)
What you see on every row
No black boxes. Every setup on the scanner shows you exactly what the models found and why.
Entry, Stop, and Target
Precise price levels calculated from the volatility models. You know your risk and reward before entering the trade.
Conviction Score (0-100)
A multi-factor score combining win rate, expectancy, Market Pulse alignment, entry proximity, and support/resistance. Higher scores mean more factors are converging.
Win Rate and Expectancy
Historical performance from 450+ days of backtested data. See how often this specific model/strategy has won on this type of setup.
Market Pulse Phase
The stock's current trend phase (Acceleration, Accumulation, Distribution, or Deceleration) and whether the trade direction aligns with it.
Model and Sensitivity
Which of the 5 VB models generated the setup, and whether it's a Conservative or Aggressive trigger. Conservative triggers have higher win rates.
Daily Swing Analysis
Today's price range compared to the stock's typical daily range. Helps you understand whether the stock is moving more or less than usual.
Real results from real traders
See the scanner in action
600+ stocks analyzed every two minutes. Conviction scores, Market Pulse context, and backtested win rates on every setup.