Market Pulse
A proprietary trend classification system that maps every stock's position in the momentum lifecycle. Four phases. 600+ symbols. Updated daily. Know where each stock sits in its trend cycle before you enter a trade.
Four phases of momentum
Every stock moves through a repeating cycle. Market Pulse identifies where each stock is right now, so you can align your trades with the prevailing force.
Acceleration
Momentum expanding. Buyers in control, volume confirming the move. Longs aligned with this phase show a 71.2% historical win rate. This is where trend-following setups have the strongest edge.
Accumulation
Building phase. The stock is consolidating after a pullback, volatility compressing. A new trend leg is forming. Setups here catch the move early before acceleration resumes.
Distribution
Weakening. Sellers absorbing demand, momentum fading. The edge shifts to the short side and caution on long entries. This phase often precedes deceleration.
Deceleration
Breaking down. Momentum reversing, selling pressure expanding. Short-side setups aligned with this phase show a 69.1% win rate. This is where counter-trend longs are most dangerous.
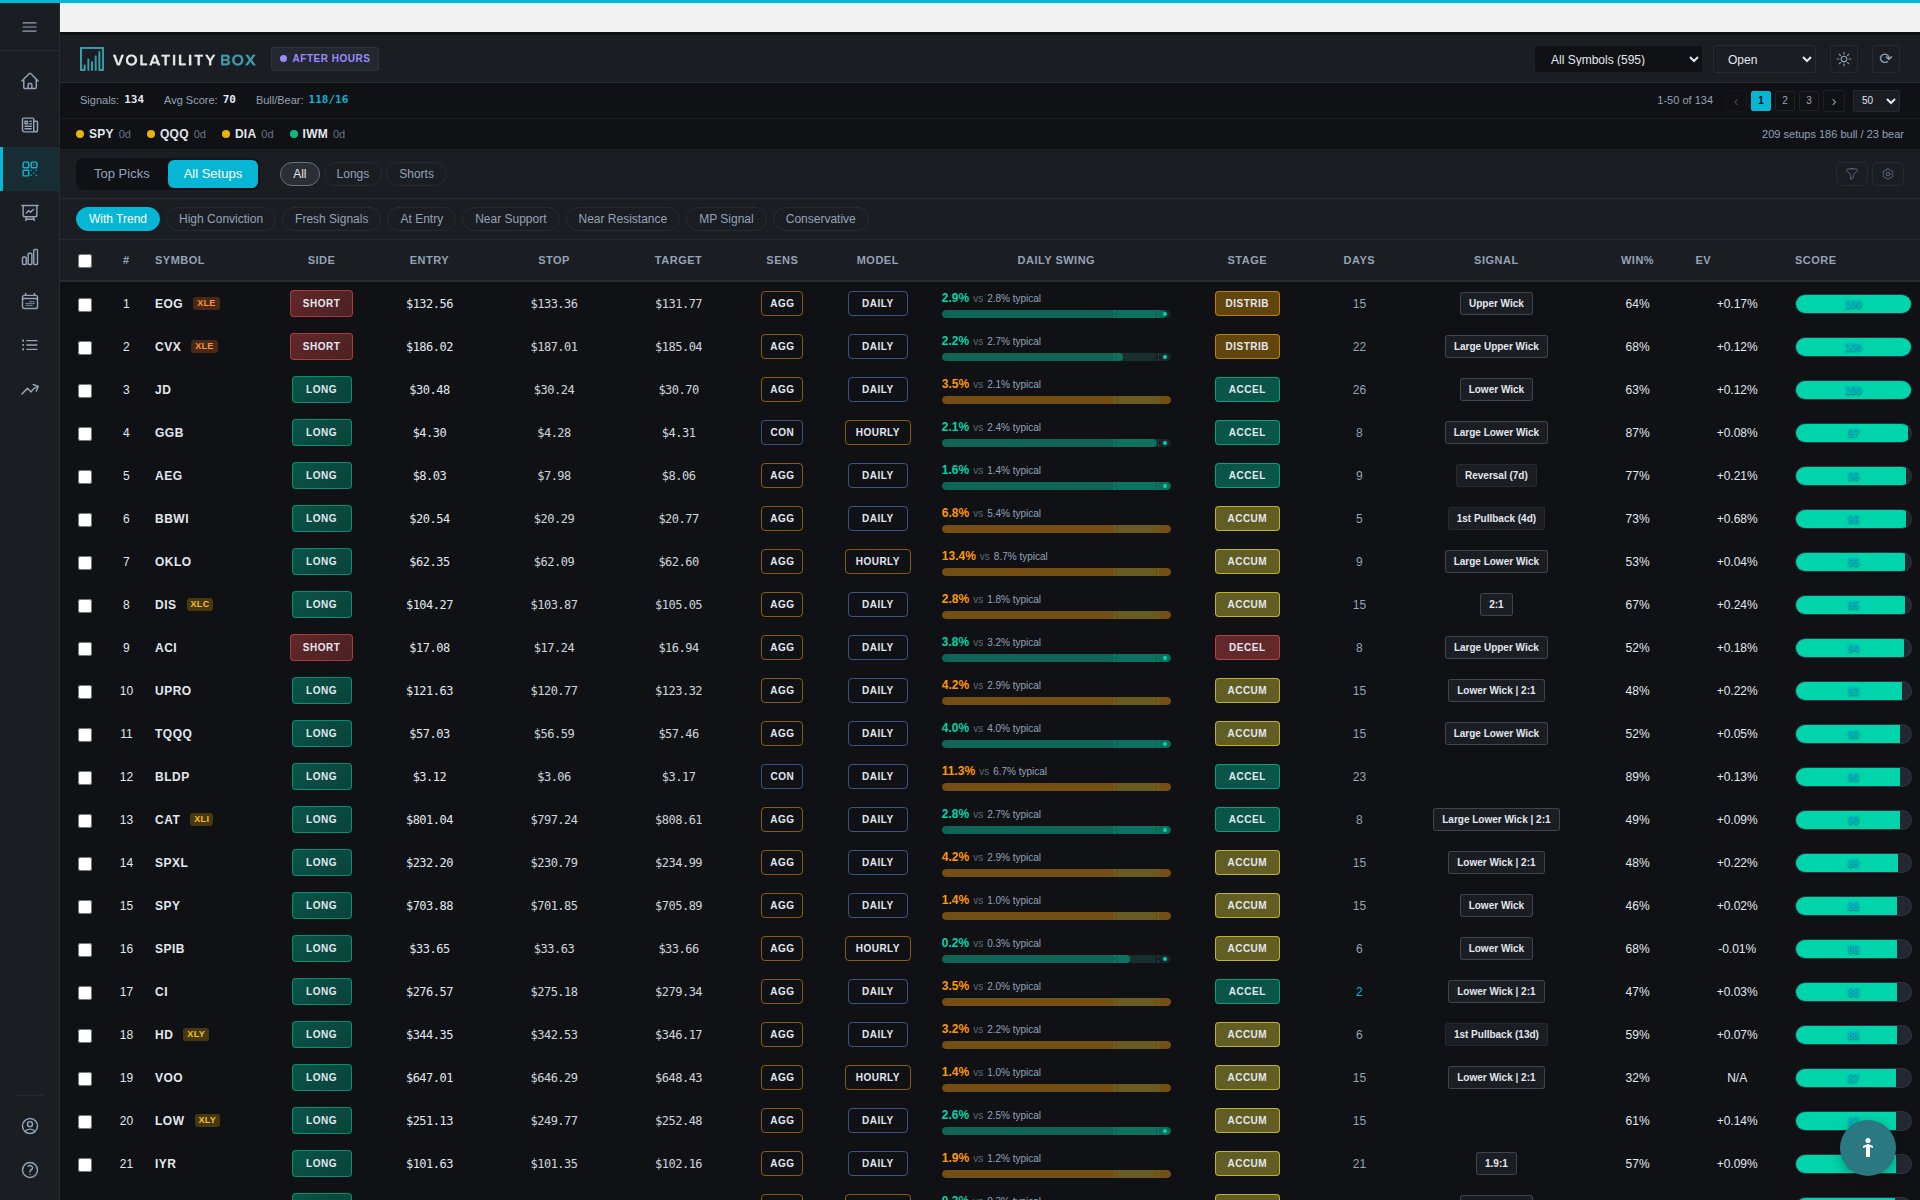
Trade with the trend, not against it
The simplest way to use Market Pulse: only take long setups in Green and Yellow phases, and short setups in Orange and Red phases. This single filter (trading in the direction of the phase) is responsible for the largest performance improvement across all VB strategies.
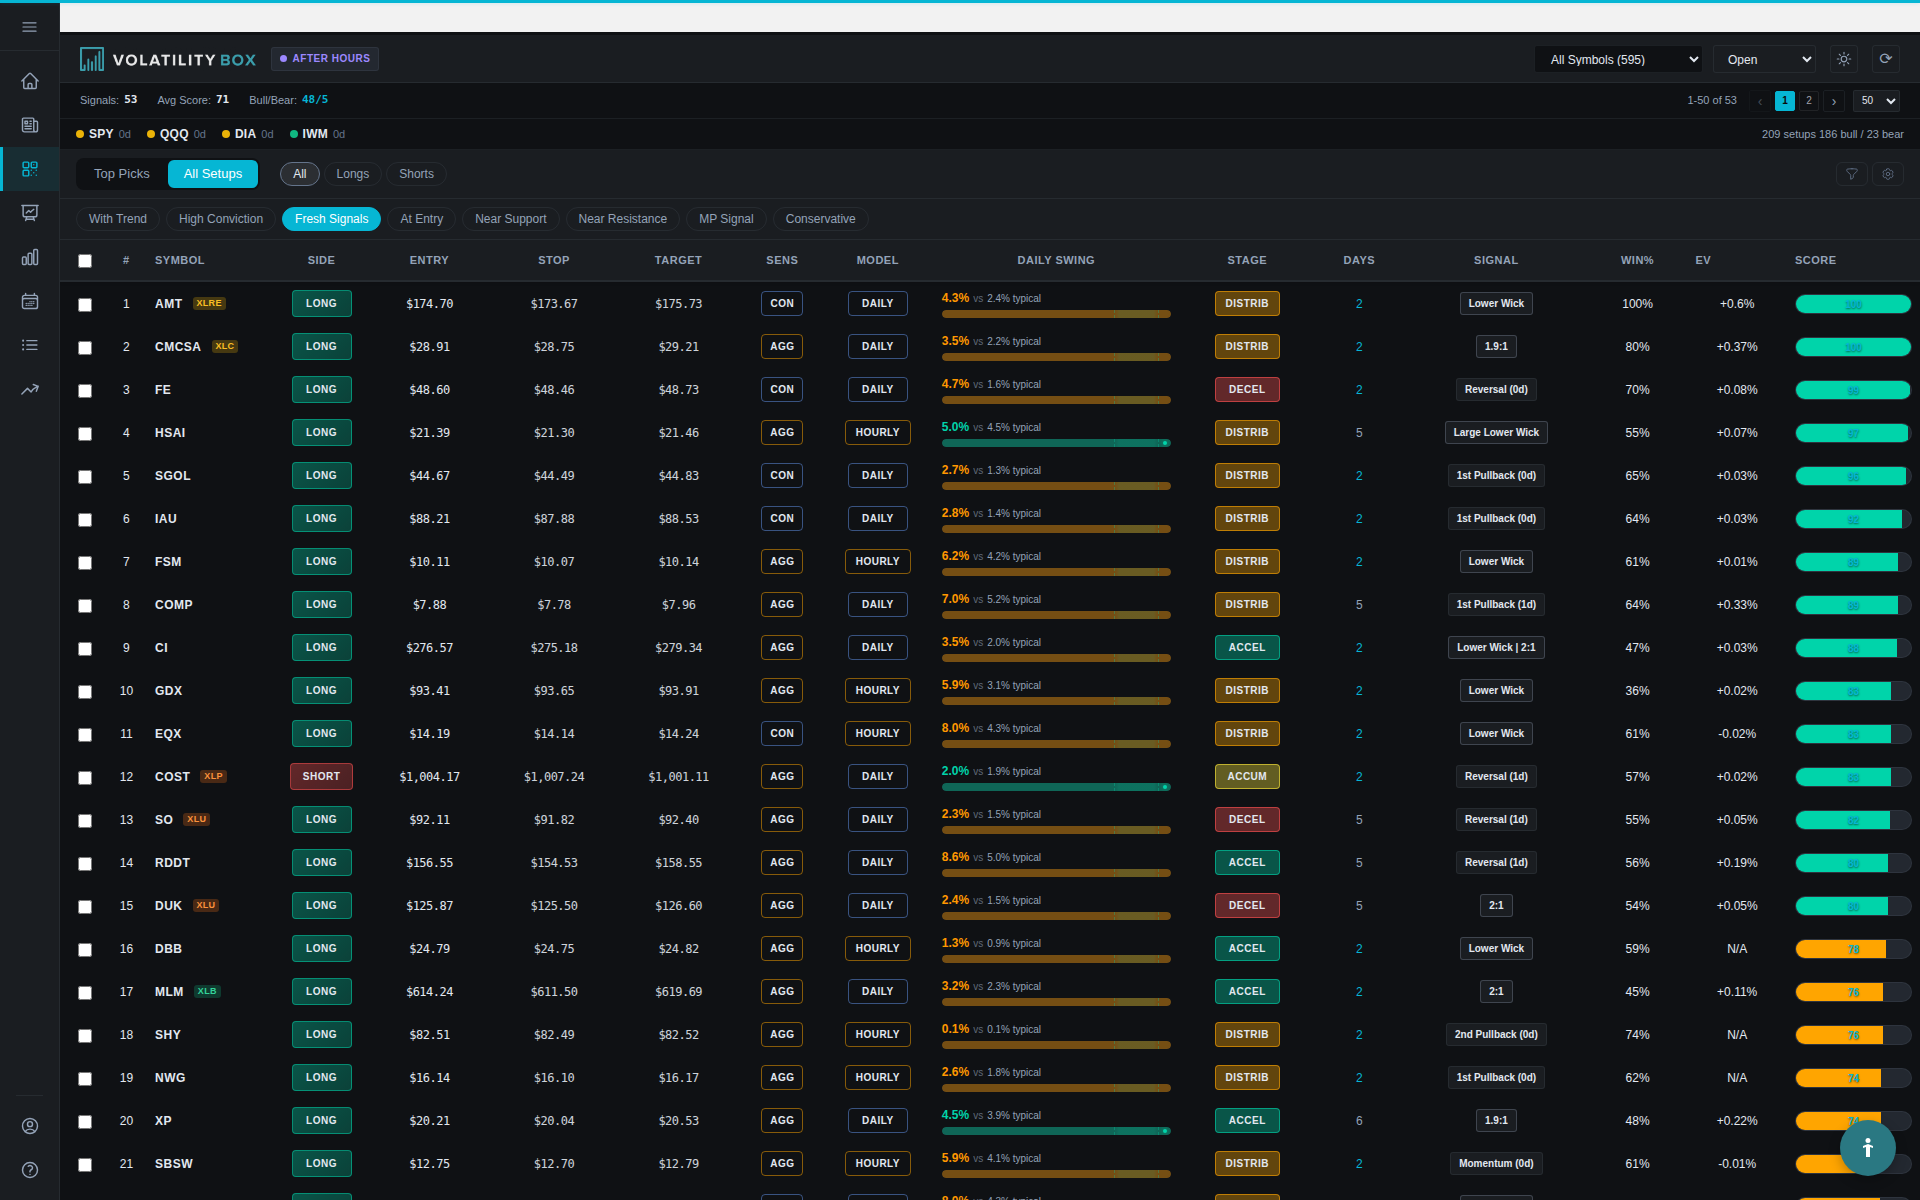
The scanner's "With Trend" preset applies this filter in one click.
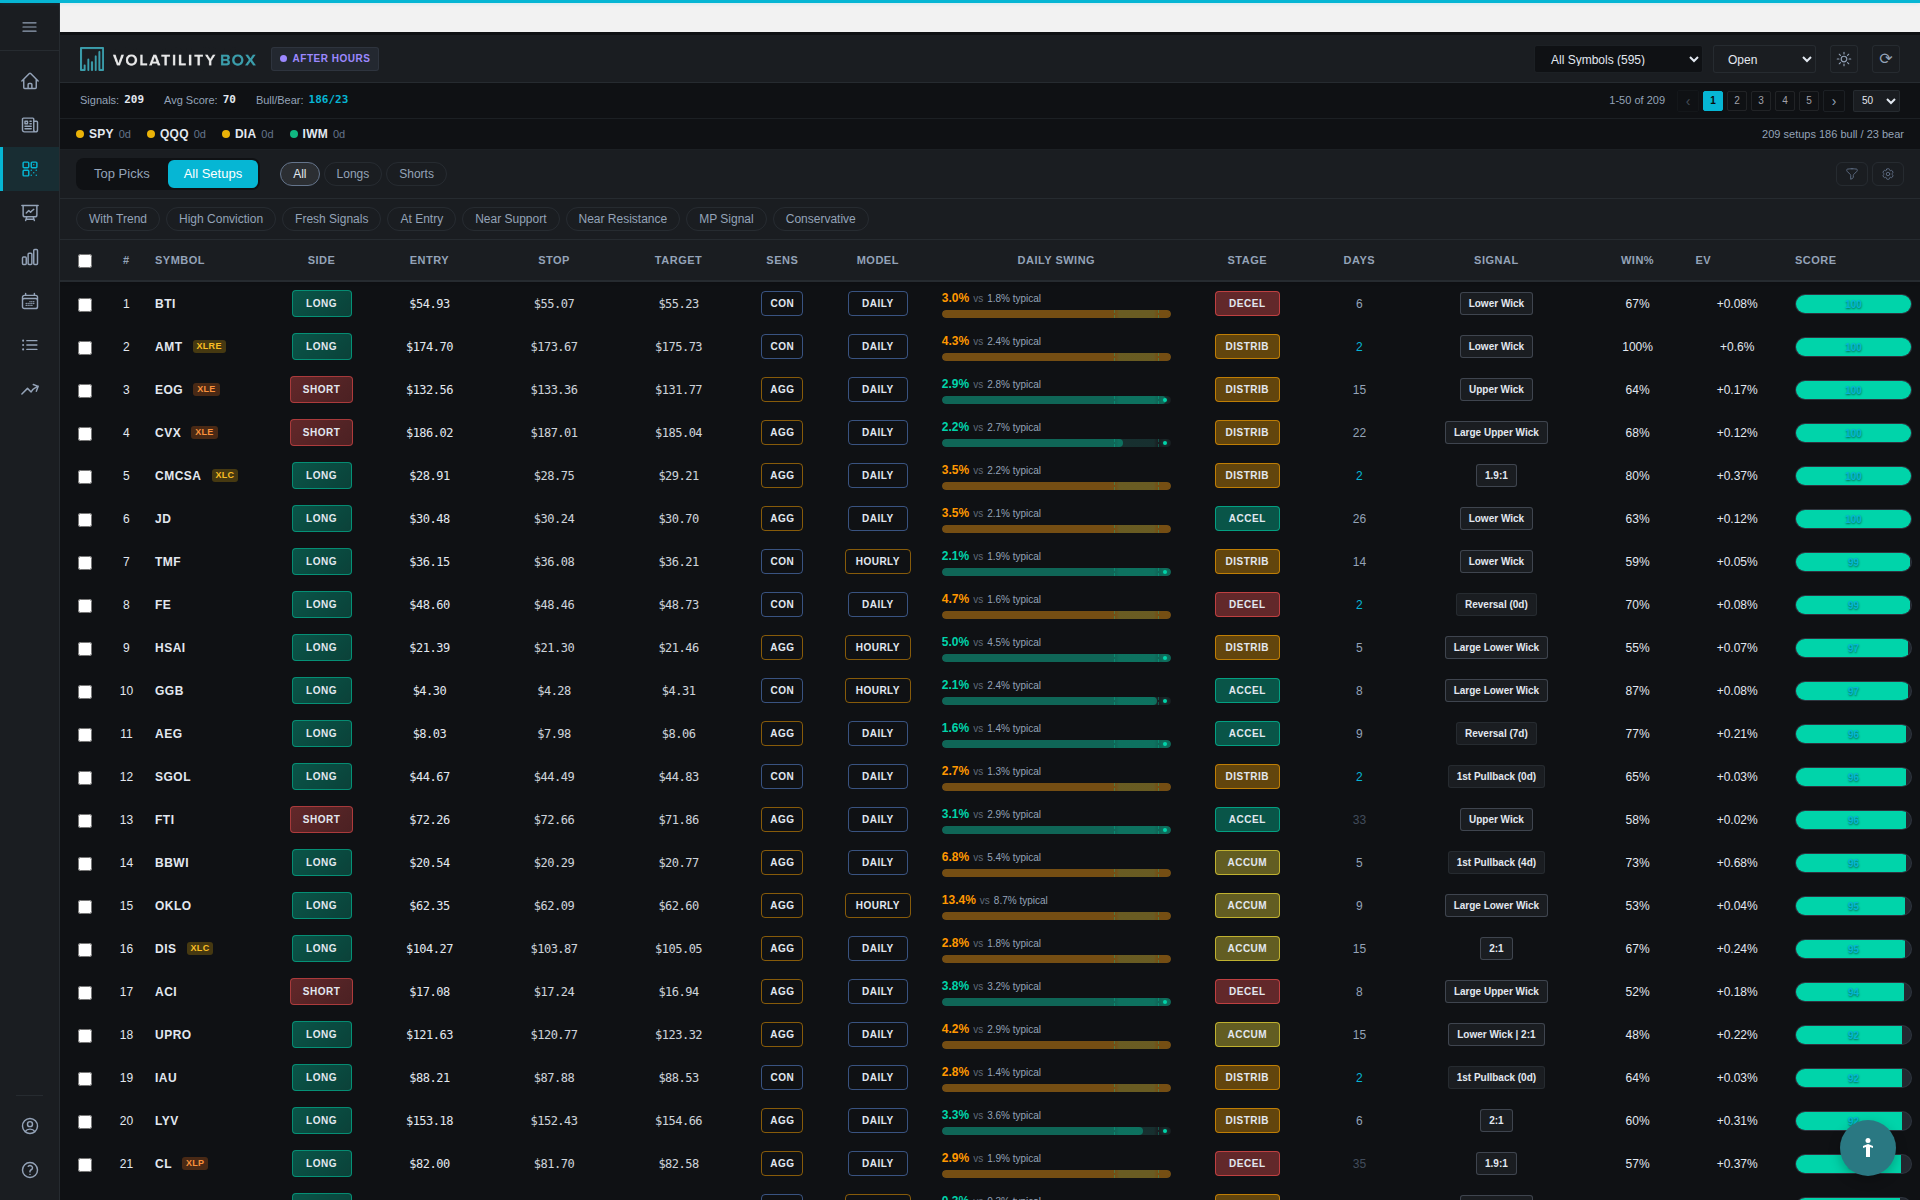
Five signal types within each phase
Market Pulse doesn't just classify the phase. It identifies specific signal events within the cycle:
- Trend Reversal Phase transition. The stock is entering a new cycle.
- First Pullback First retracement in the new trend. High-probability continuation.
- Momentum Entry Trend acceleration confirmed. Strongest momentum reading.
- Second Pullback Deeper retracement. Edge is still present but smaller.
- Trend Continuation Extended trend. Edge diminishing, use caution.
Phase alignment changes everything
Historical win rates for setups aligned with their Market Pulse phase vs. setups fighting it.
Aligned with Phase
Against the Phase
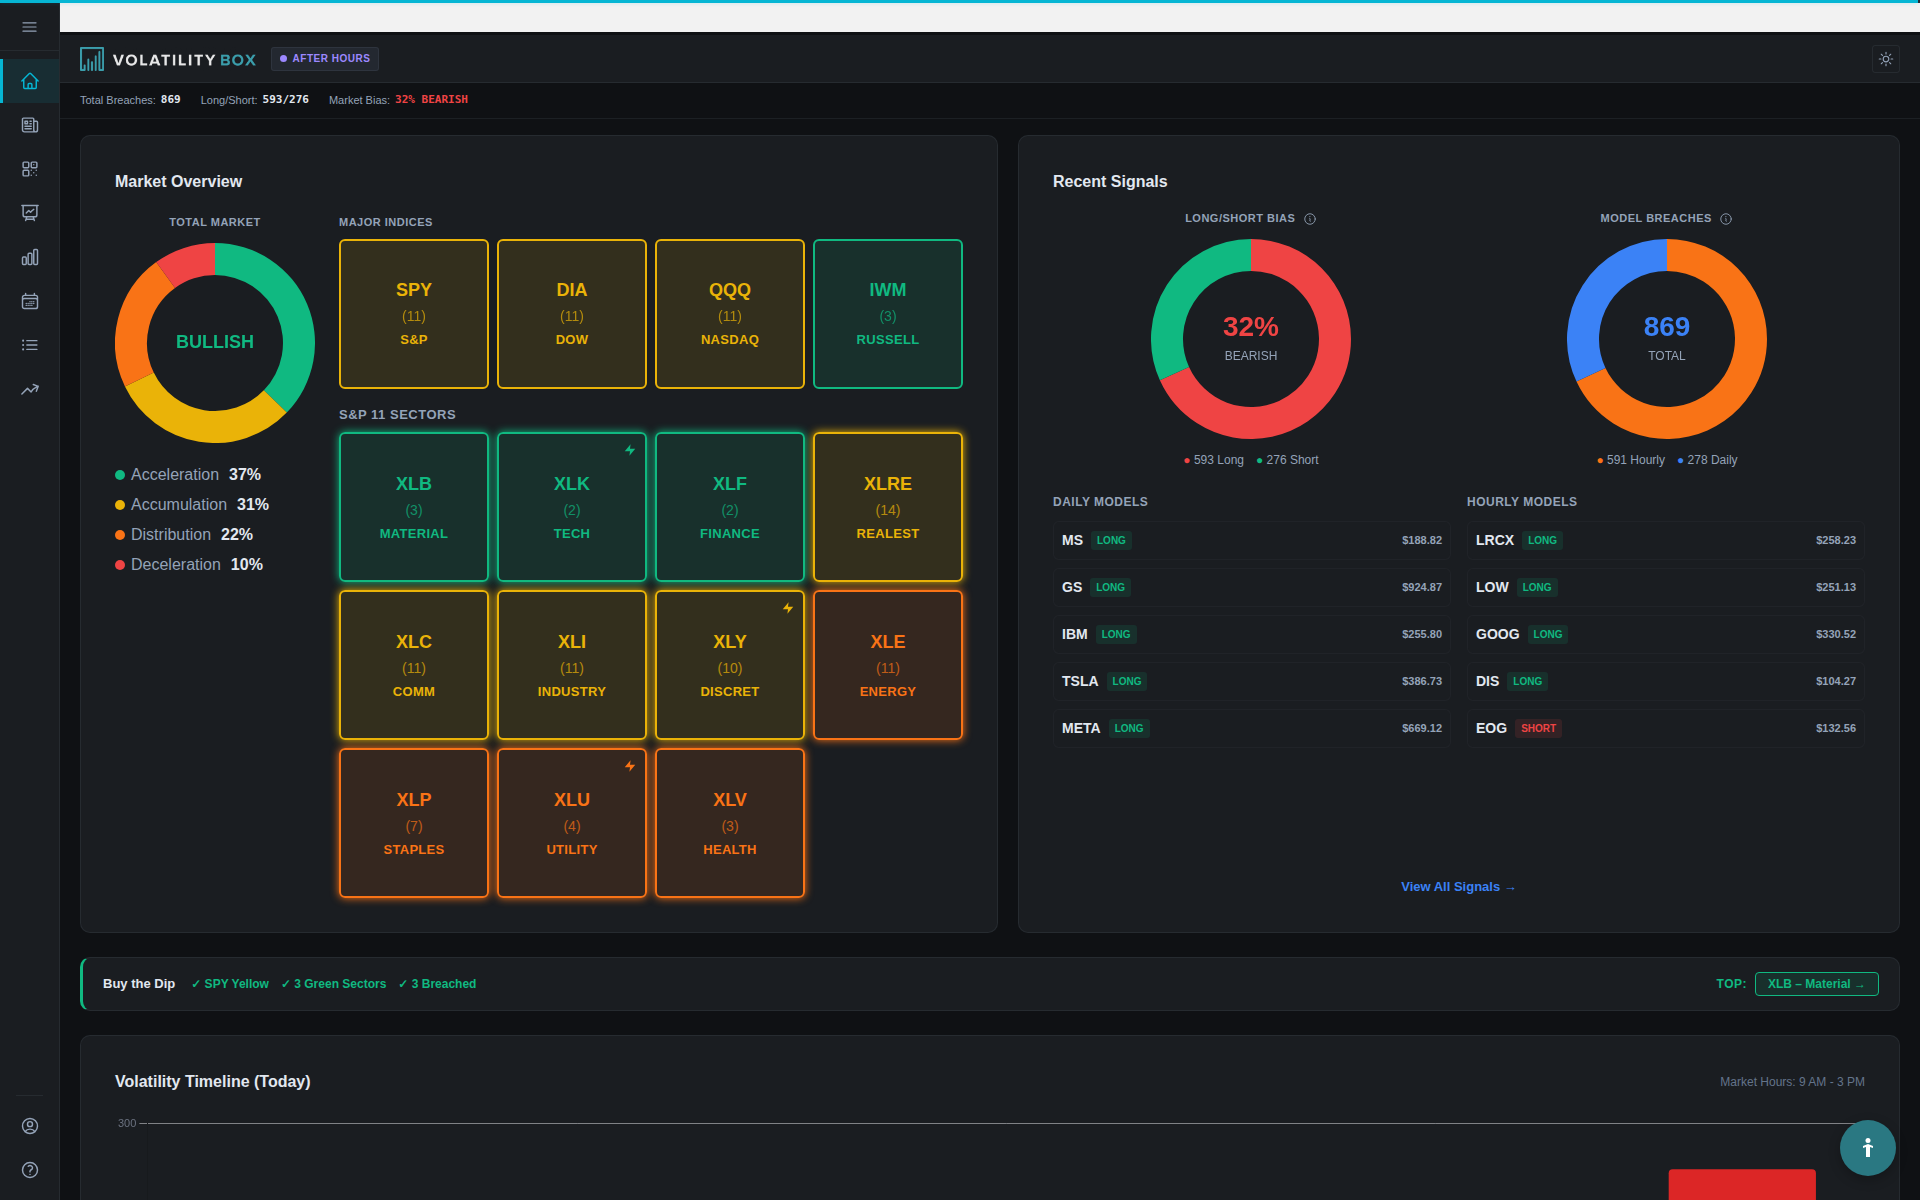
All 11 S&P sectors, classified
Market Pulse doesn't just classify individual stocks. It aggregates phase data across all 11 S&P sectors. At a glance, you can see which sectors are in acceleration (tailwinds for longs) and which are in deceleration (tailwinds for shorts).
The scanner's market context strip shows SPY, QQQ, DIA, and IWM phases in real time.
See the trend before you trade
Every stock classified. Every phase mapped. Updated daily across 600+ symbols.