See how a setup has behaved, before you trade it.
The Backtester runs any symbol against any model across years of history, so you can study how a setup has held up through the good stretches and the rough ones, with nothing hidden.

The whole picture, not just the highlights.
A setup is only worth trading if it has held up over time. The Backtester lays out the full record so you can judge it before you put money behind it.
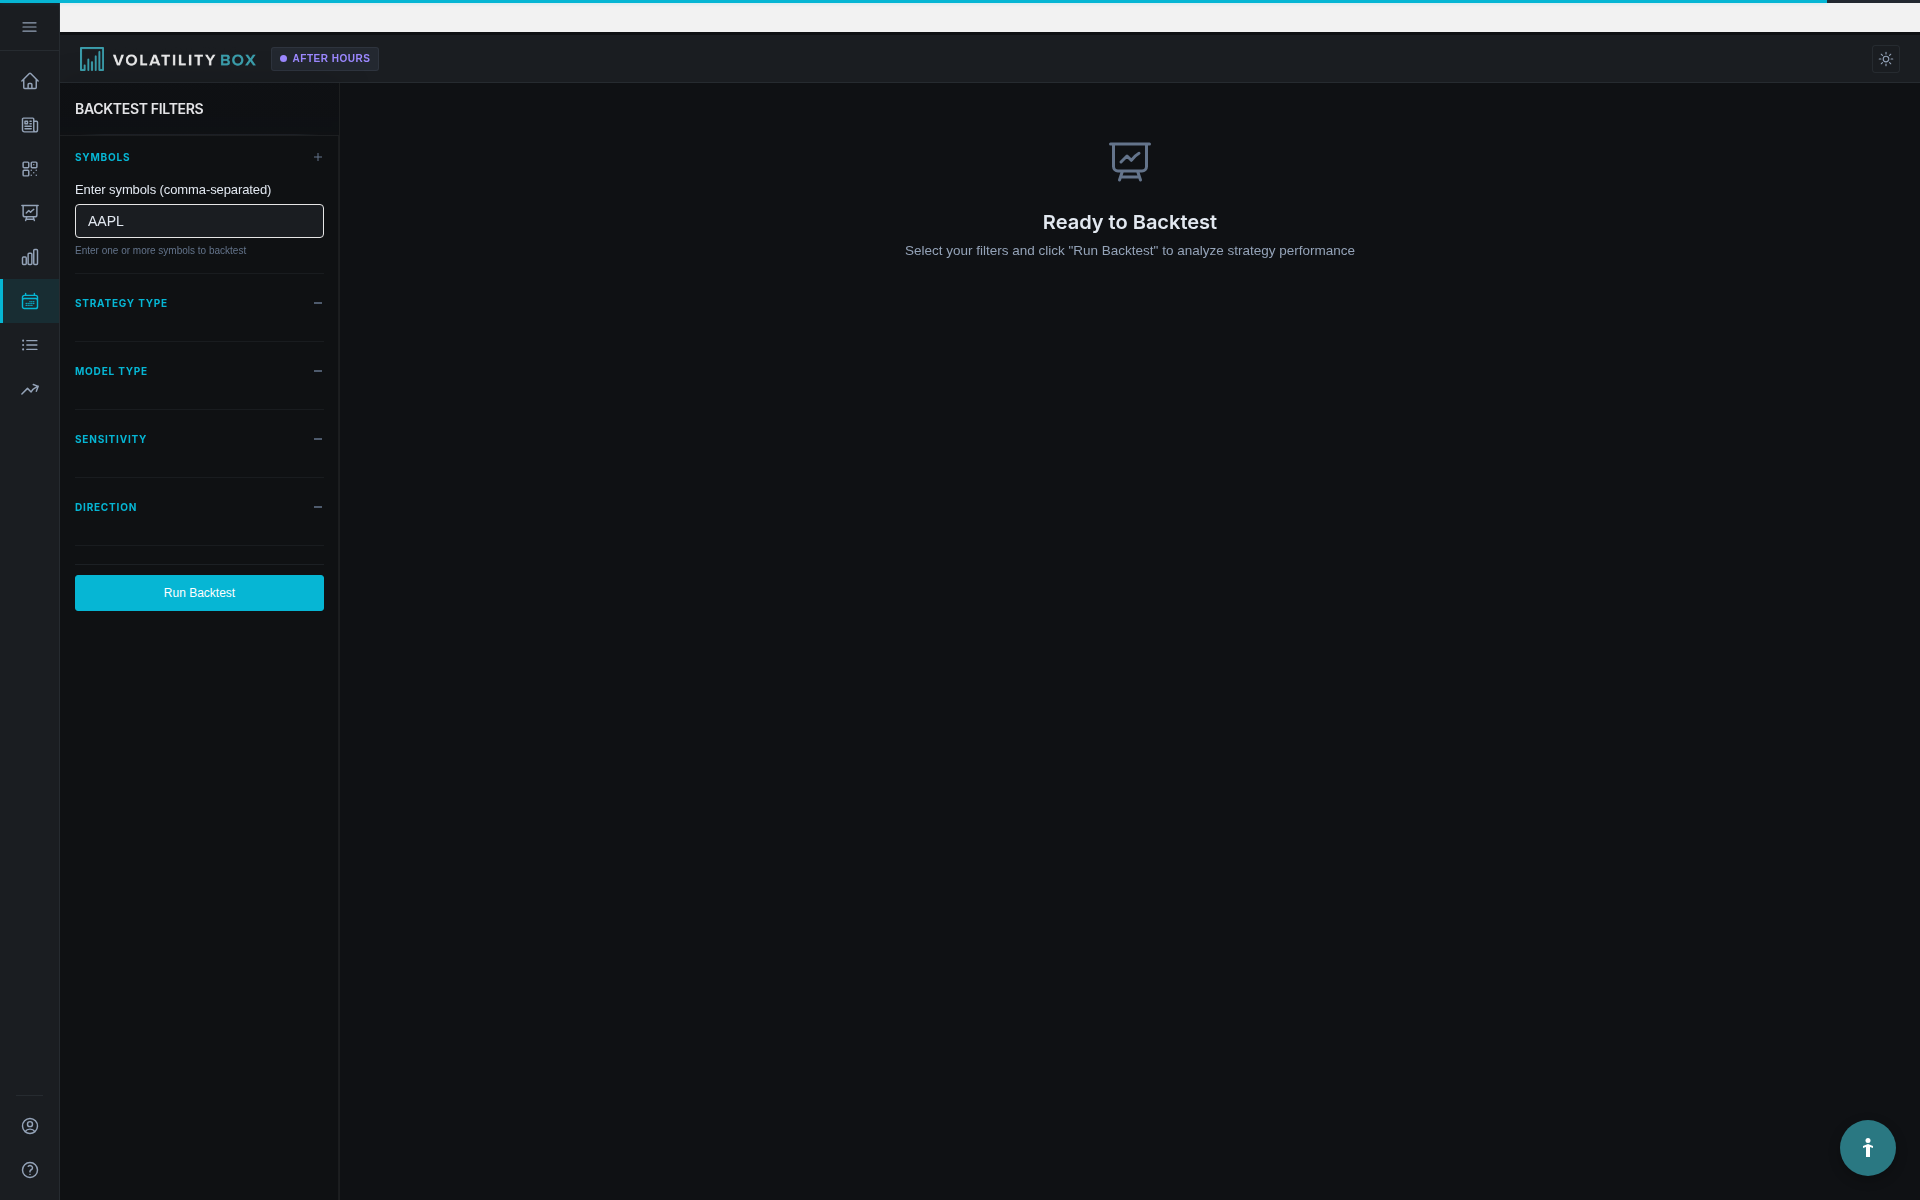
Pick a symbol
Run any name in the universe. Test the stocks and ETFs you actually trade, not a generic sample.
Pick a model
Choose how the setup is defined, then see how that exact configuration would have played out on your symbol.
See every trade
The record is laid out trade by trade: the wins, the losses, and everything in between.
Nothing hidden
No cherry-picked windows. You see the full history, the quiet periods and the rough patches alike.
The real track record, good stretches and bad.
Most traders take a setup because it feels right in the moment. The Backtester lets you ask a steadier question: how has this exact setup behaved on this exact symbol across years of sessions?
You see the run through winning and losing stretches, the calm periods and the drawdowns. That full view tells you whether a setup is worth your conviction or worth skipping.

Compare models, side by side.
Not every model fits every name. One symbol may read best on the daily setup while another favors the hourly. The Backtester runs the same symbol through each one and compares the results directly.
- Daily versus hourly on the same symbol, so you can see which timeframe suits it.
- Conservative versus aggressive, so you can weigh patience against reach.
- One watchlist, every model, so you settle on the fit that has held up best.
Trade with data, not with hope.
The point of looking back is not certainty, it is honesty. Once you have seen how a setup behaves over years, you stop guessing and start choosing on evidence.
Test before you trade
Study how a setup has behaved before you commit to it, instead of finding out with real money.
See the full ride
The record covers winning and losing stretches, so you know the rough patches are part of it.
Find the right fit
Compare models on your own watchlist and settle on the configuration that has held up best.
What traders say.
See how it has behaved before you trade it.
Stop trading on a feeling. Let the history tell you what to expect.