Everything you need to trade volatility, in one place.
One platform reads the liquid markets through daily and hourly volatility models, tells you which way the trend is leaning, and hands you the level to act on. Stop charting by hand and trade with the move.
New here? Start with the walkthrough.
A short series that shows you how the platform works, how to find setups, and how to act on them with confidence.
How the platform works.
Start with the read to see where the market is leaning. The scanner surfaces the names already moving your way, with the levels worked out for you. Then take it to your charts.
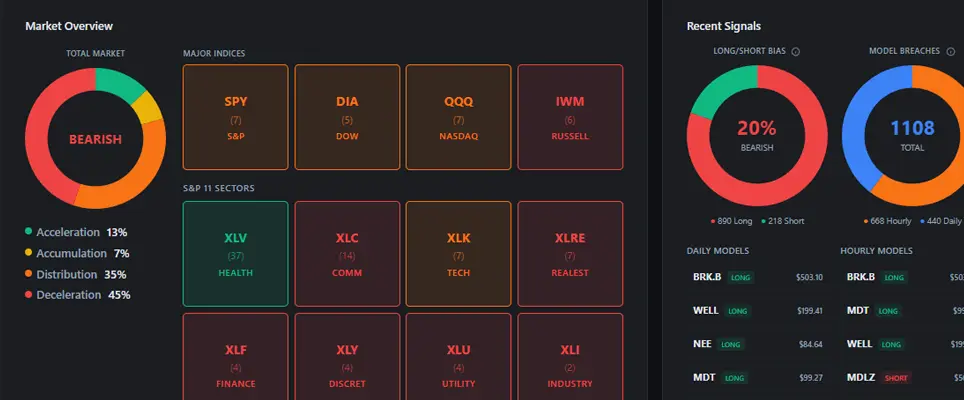
Dashboard
Your command center. See what is moving, what is not, and where the best setups are forming, all in one glance.
Learn more →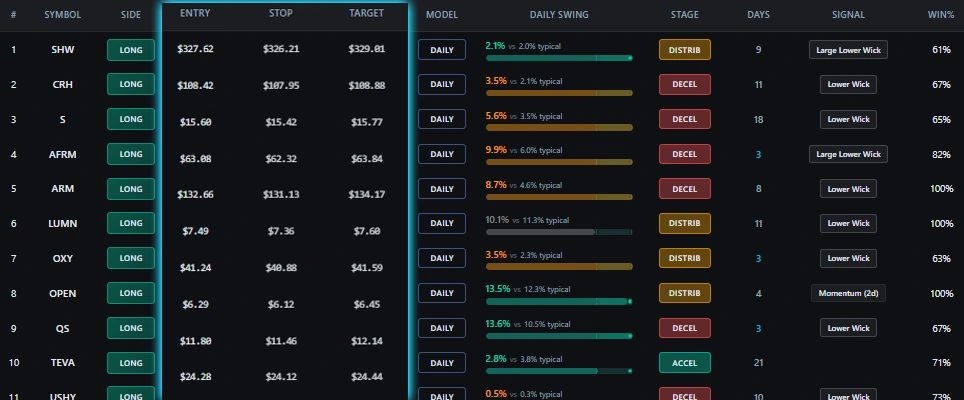
Dynamic entry and exit levels
Stop guessing where to enter or exit. The platform reads each name and hands you the entry, stop, and target.
Learn more →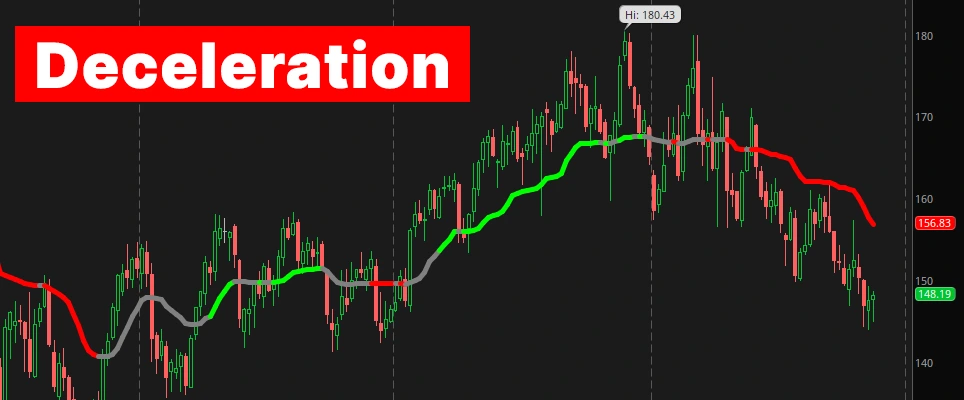
Market Pulse
Every name shows which way it is leaning and how hard to push. Know the environment before you trade.
Learn more →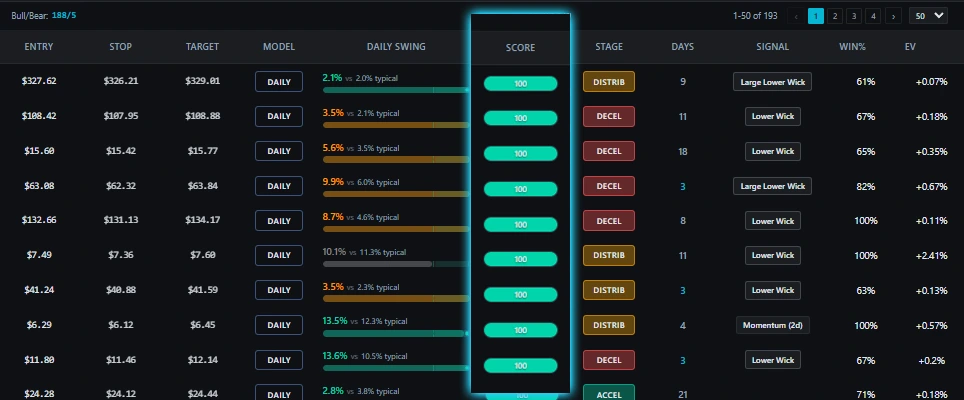
Conviction scoring
Not all signals are equal. Each gets a strength score so you focus on the best, and stale ones fall away.
Learn more →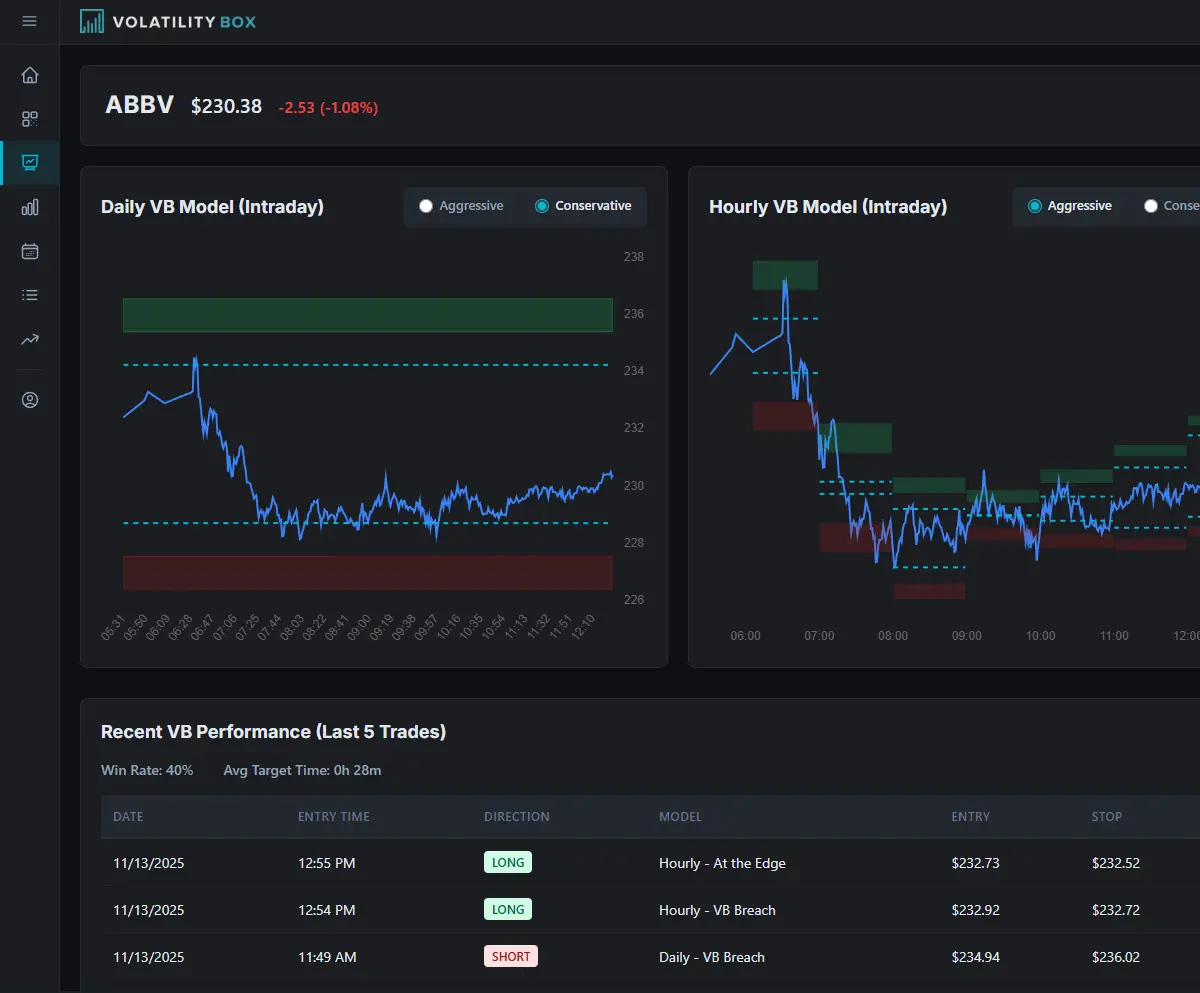
Built-in charts
Levels, trend, and recent history on every symbol. Confirm a setup at a glance without leaving the platform.
Learn more →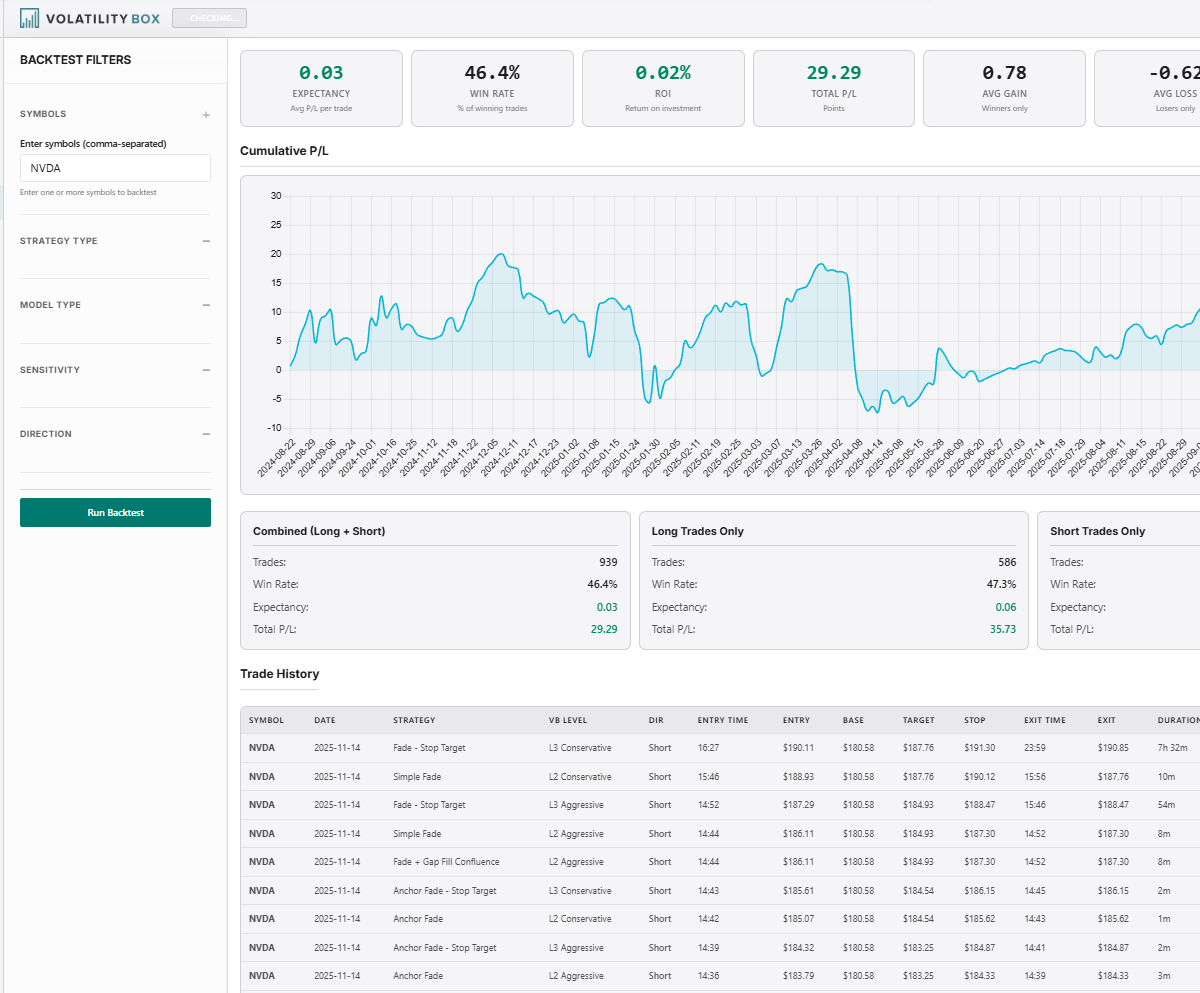
Backtester
See how a name has behaved across a long stretch of history, so you trade its character rather than a guess.
Learn more →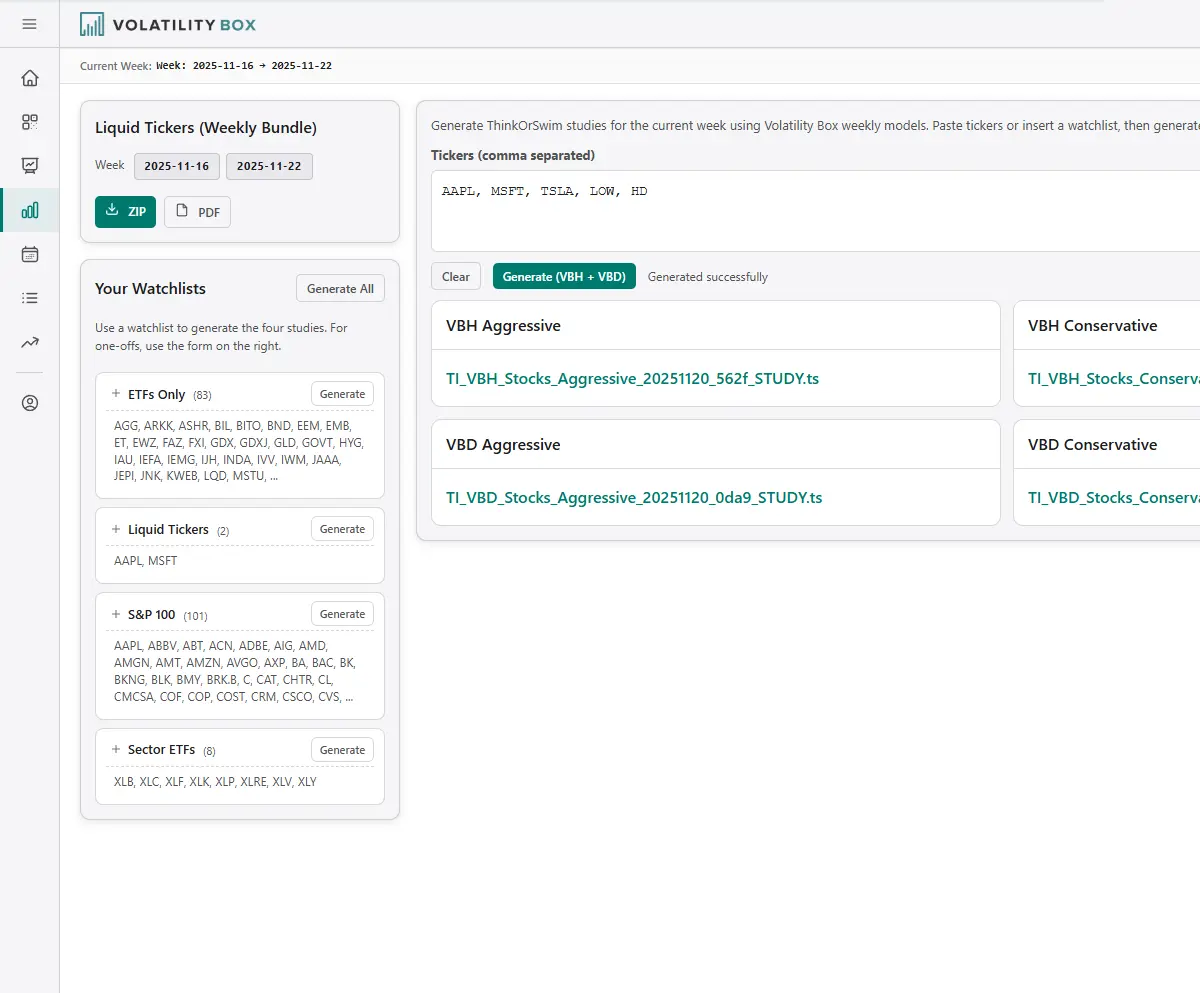
ThinkScript export
One click to take the levels into ThinkOrSwim. Copy, paste, and they appear on your chart.
Learn more →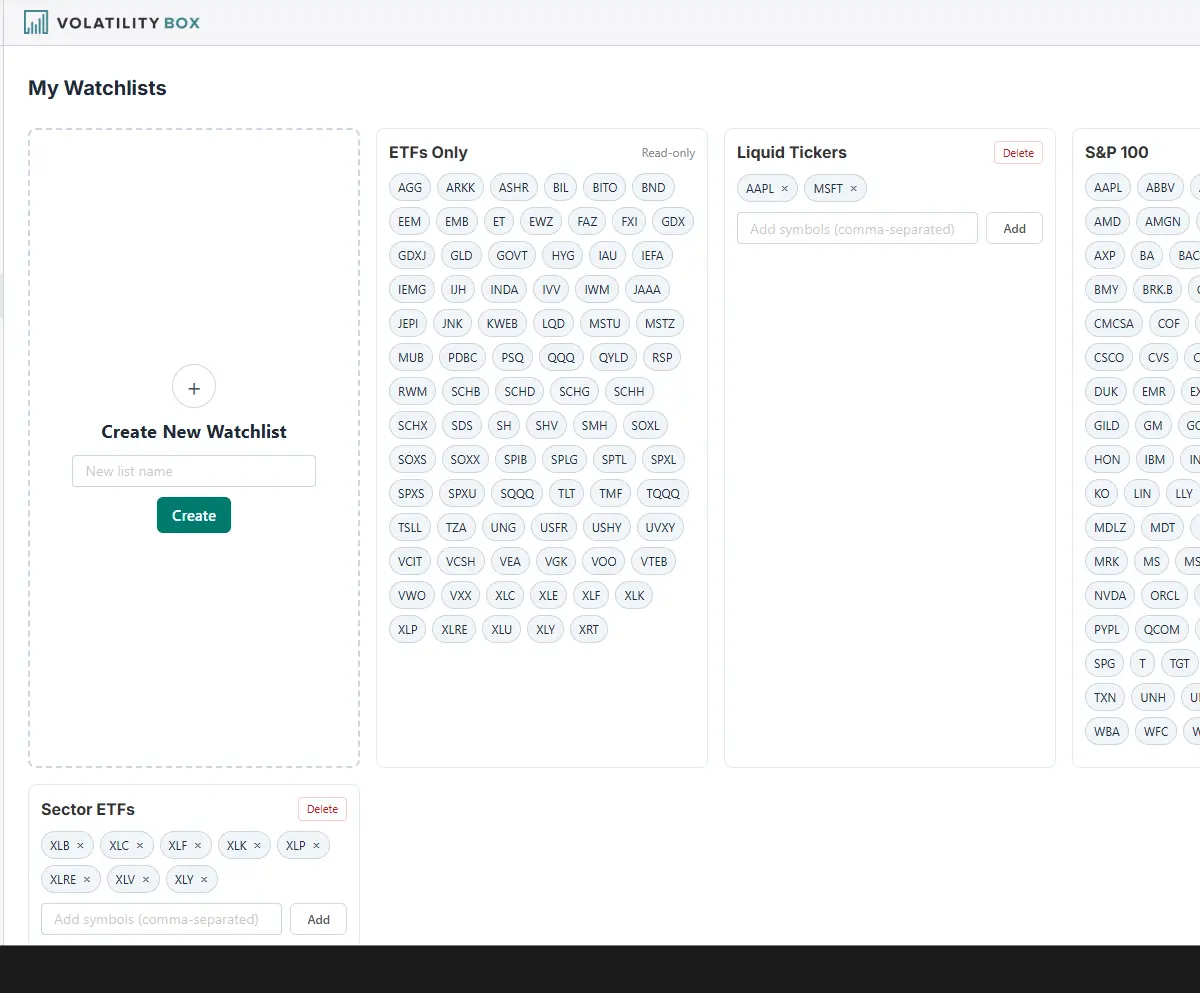
Custom watchlists
Build lists from any of the names we cover and filter the scanner to only the symbols that matter to you.
Learn more →Four readings, one glance.
Every name we cover sits somewhere on a spectrum from quiet to wide open. The read places each one for you, so you know how hard to push before you ever look at a chart.
Low volatility
Ranges are tight and setups are scarce. The read tells you to wait rather than force a trade.
Starting to move
A trend is waking up. The read flags it while there is still room to act, not after the move is done.
One side in control
Direction is clear. Trading with the trend and holding for swings works best here.
High volatility
The widest ranges and the largest risk. Focus and position size matter most here.
Everything included with your membership.
All of the tools, the models, and the education. No upsells, no contracts.
All premium tools
Complete access to every scanner, model, and backtesting tool from day one. Nothing else to buy.
The full squeeze course
Over 160 minutes across 18 modules teaching the complete squeeze trading system.
Weekly data updates
Stock and futures models refreshed every Sunday, so your levels are current for the week ahead.
Complete setup guide
Step by step instructions and observations for putting the platform to work in your own trading.
Month to month
No long term contracts, cancel any time, and your rate locks in with no future increases.
ThinkOrSwim export
Generate the code for any model and paste it straight into your charts.
Who uses Volatility Box.
Day traders, swing traders, options traders, and portfolio managers all work from the same read, with different timeframes and position sizing.
Day traders
Lean on the hourly read for intraday setups as new entry zones appear through the session.
- Hourly volatility models
- Live scanner refresh
- Entry, stop, target included
- Market Pulse context
Swing traders
Use the daily read for multi-day positions and lean on history to see which names suit you.
- Daily volatility models
- Long backtest history
- Behavior by setup
- Custom watchlists
Options traders
The platform marks the entry zone on the underlying. You decide whether to trade shares or options.
- Entry zones for the underlying
- You pick the contract
- Works with weekly or 0DTE
- Trend context built in
Portfolio managers
Track how the read rolls up across all 11 sectors for cleaner allocation decisions.
- Sector rotation view
- Top holdings by sector
- Read breakdown per sector
- Top-down context
Frequently asked questions.
How does the platform decide where to enter and exit?+
It reads each name through volatility models that adapt as conditions change, then hands you an entry, a stop, and a target. The levels move with the market rather than sitting at fixed percentages.
What is Market Pulse and why does it matter?+
Market Pulse is the read on which way a name is leaning and how hard to push, from quiet to wide open. Every name we cover shows its current read, so you know the environment before you trade.
How often does the scanner update?+
It refreshes through the session, so you catch new setups as they form and the levels stay current with the latest price action.
Can I use it with my existing brokerage?+
Yes. The platform is broker agnostic. ThinkOrSwim users get one-click code, and the levels can be applied by hand on any charting or order entry system.
Do I need coding or technical analysis experience?+
No. The platform handles the analysis. If you understand entry price, stop loss, and profit target, you are ready to use it.
How do I use this for options?+
The platform marks the entry, stop, and target on the underlying. You choose whether to trade shares or options and pick the strike and expiration that fit. Long reads point to calls, short reads to puts.
Can I cancel?+
Any time, in two clicks. No contracts and no retention games.
See where the market is leaning today.
Stop guessing which name, which direction, and when. Let the read show you.